



Amazon is two very different businesses under one roof. One is the world’s largest online store, a low-margin operation built on logistics, selection and convenience. The other is Amazon Web Services (AWS), a high-margin cloud computing business that now earns most of the group’s operating profit.
This study looks at how each part makes money, how durable its advantages are, and what the company’s record capital spending on artificial intelligence (AI) means for shareholders. It ends with our fair value estimate. None of it is a recommendation to buy, sell or hold.
Amazon at a glance
NASDAQ: AMZN · Seattle, Washington · CEO Andy Jassy (CEO since July 2021) · Fiscal year ends 31 December
Figures as at 19 October 2026 unless stated. Sources are listed at the end of the article. Figures will date.
How we see the business, in one picture
Our assessment of business characteristics, scored 1 to 5. Amazon’s scale and its cloud and logistics networks are very hard to copy, and the business has compounded for three decades. We mark it down on capital allocation and predictability because it is spending around US$220 billion on capital projects in 2026, free cash flow has turned negative, and reported profits are swollen by investment gains that may not repeat.
Lindy business profile: Amazon
Our assessment of business characteristics, scored 1 to 5. Not a rating of the shares or a recommendation.
Each score is explained in the sections below.
What does Amazon do?
Amazon sells goods online and in physical stores, lets independent merchants sell through its website, sells advertising, runs the Prime subscription, and rents computing power and software to businesses through AWS. It reports three segments: North America, International and AWS.
In the June 2026 quarter, net sales were US$200.6 billion, up 20% on a year earlier. AWS supplied 21% of revenue but 61% of operating income.
- North America. Online and physical stores, third-party seller services, advertising and subscriptions in the United States and Canada. Q2 2026 sales of US$116.2 billion at a 7.9% operating margin.
- International. The same retail model in other countries, including the United Kingdom, Germany, Japan and India. Q2 2026 sales of US$42.2 billion at a 4.1% operating margin.
- AWS. Cloud computing, storage, databases, AI services such as Amazon Bedrock, and its own chips (Graviton and Trainium). Q2 2026 sales of US$42.2 billion at a 39.4% operating margin.
The mix is shifting towards higher-margin services. Advertising grew 26% to US$19.8 billion in the quarter and AWS grew 37%, while online store sales grew 15%. Because these faster-growing lines carry far richer margins than selling goods, profit is growing faster than revenue.
Where the revenue came from, quarter to 30 June 2026
Share of US$200.6B total net sales
Amazon’s three reporting segments. Advertising, subscriptions and third-party seller services sit inside North America and International. Source: Amazon Q2 2026 earnings release (8-K exhibit 99.1).
How fast Amazon is growing
Revenue grew from US$469.8 billion in 2021 to US$716.9 billion in 2025, a compound rate of about 11% a year. Growth was 11% in 2024 and 12% in 2025, and it picked up to 20% in the June 2026 quarter on the back of AWS and advertising.
Analysts expect 2026 revenue of about US$828.6 billion, up 16%. Management guided September 2026 quarter sales of US$197.0 billion to US$202.0 billion, growth of 9% to 12%, which it says is held back by nearly 4 percentage points because Prime Day fell in a different quarter than last year.
Amazon annual revenue
US$ billions, fiscal years ending 31 December
Source: StockAnalysis financial statements; FY26 estimate is the StockAnalysis consensus as at 19 October 2026.
View the data
| Revenue | |
|---|---|
| FY21 | 470 |
| FY22 | 514 |
| FY23 | 575 |
| FY24 | 638 |
| FY25 | 717 |
| FY26 est (estimate) | 829 |
The cloud business
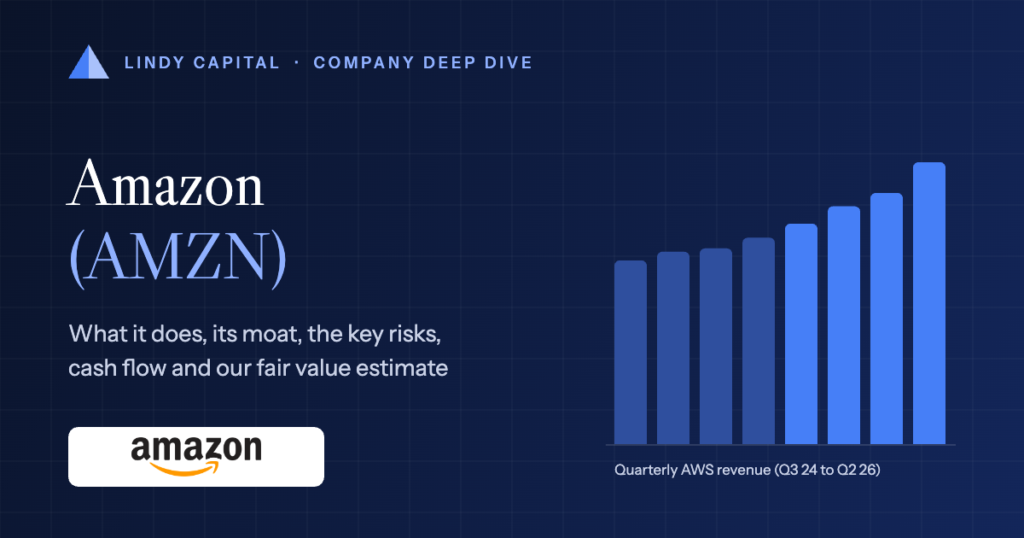
AWS rents servers, storage and software over the internet so customers do not have to run their own data centres. Revenue rose from US$27.5 billion in the September 2024 quarter to US$42.2 billion in the June 2026 quarter. Growth accelerated to 37%, which chief executive Andy Jassy called the fastest in 18 quarters.
AWS operating income was US$16.6 billion in the June 2026 quarter, a 39.4% margin, up from 32.9% a year earlier. Over the last four quarters AWS earned US$54.7 billion of operating income, 58% of the group total. Management said on the call that the backlog of contracted future revenue stood at US$496 billion and that it still cannot build capacity fast enough to meet demand in 2026 or 2027.
Quarterly AWS revenue
US$ billions
AWS segment net sales. AWS operating income over the same quarters: 10.4, 10.6, 11.5, 10.2, 11.4, 12.5, 14.2, 16.6. Source: Amazon Q4 2025 and Q2 2026 earnings releases.
View the data
| Value | |
|---|---|
| Q3 24 | 27.5 |
| Q4 24 | 28.8 |
| Q1 25 | 29.3 |
| Q2 25 | 30.9 |
| Q3 25 | 33.0 |
| Q4 25 | 35.6 |
| Q1 26 | 37.6 |
| Q2 26 | 42.2 |
How Amazon makes money
Selling goods. Online and physical store sales were US$76.2 billion in the June 2026 quarter. This is the largest line but earns thin margins because Amazon carries the cost of the goods, warehouses and delivery.
Third-party seller services. Commissions, fulfilment and shipping fees from independent merchants, US$46.8 billion in the quarter, up 16%. Amazon earns a fee on each sale without owning the stock.
Advertising. Sponsored product listings, Prime Video ads and other placements, US$19.8 billion in the quarter, up 26%. Ads shown to shoppers who are ready to buy are valuable to sellers and cost Amazon little to serve.
Subscriptions. Prime membership fees and digital services, US$13.7 billion in the quarter, up 12%. Prime ties shoppers to Amazon through fast delivery and video.
AWS. Cloud computing, US$42.2 billion in the quarter, up 37%, and the group’s main profit engine.
The moat: where the advantage comes from
A moat is a lasting advantage that protects profits from competitors. Amazon has several, and they reinforce each other: the retail network feeds advertising, and AWS funds investment across the group.
Sources of competitive advantage
Our assessment of which classic moat sources apply to Amazon
| Moat source | Applies? | Where it shows up |
|---|---|---|
| Switching costs | Strong | AWS customers build systems around its services and contracted backlog; moving large workloads is costly and risky. Prime members lose delivery and video benefits if they leave. |
| Intangible assets | Strong | One of the most recognised consumer brands, plus customer purchase data that sharpens advertising and recommendations. |
| Network effects | Strong | More shoppers attract more third-party sellers, whose wider selection attracts more shoppers. Advertisers follow the shoppers. |
| Cost advantage and scale | Strong | A logistics network delivering same-day and next-day at a scale few can match, and data centre and in-house chip scale in AWS. |
| Efficient scale | Partial | Only a handful of companies can fund hyperscale cloud networks, but the cloud market is contested by Microsoft and Alphabet rather than naturally limited to one player. |
The moat is wide, but it is being tested. AI is the main battleground in cloud, and Amazon must keep spending heavily to stay in front. In retail, regulators are examining whether its marketplace rules use that scale unfairly.
Customers and competition
Amazon competes on two fronts with very different rivals.
- Microsoft (Azure) is AWS’s main rival for large enterprise cloud contracts and benefits from its OpenAI relationship and Office customer base.
- Alphabet (Google Cloud) competes in cloud and AI, and with Amazon for advertising budgets.
- Walmart is the largest physical retailer and is growing its own online marketplace, delivery and advertising business.
- Low-cost cross-border platforms such as Temu and Shein compete on price for discretionary goods.
- Specialist AI cloud providers rent graphics processors and compete for AI training workloads.
How Amazon compares with its peers
We compare Amazon with Microsoft and Walmart because each mirrors one half of the business: Microsoft is AWS’s closest cloud rival and a software business of similar size, and Walmart is the only retailer with comparable revenue. Alphabet also competes in cloud and advertising, but its economics are driven by search, so it says less about either Amazon half.
Amazon against its closest listed peers
Figures at the close on 19 October 2026. GAAP margins unless stated; forward P/E uses analysts’ next-year earnings estimates.
| Measure | Amazon AMZN | Microsoft MSFT | Walmart WMT |
|---|---|---|---|
| Market value | US$2.83T | US$3.96T | US$941.7B |
| Revenue, last 12 months | US$775.7B | US$331.8B | US$735.8B |
| Gross margin | 50.8% | 67.9% | 24.8% |
| Operating margin (GAAP) | 12.1% | 46.8% | 3.9% |
| Free cash flow margin | (1.5%) | 20.2% | 1.8% |
| Return on invested capital | 11.9% | 26.2% | 13.3% |
| Net cash (net debt) | (US$128.6B) | (US$52.0B) | (US$63.6B) |
| Forward P/E | 27.9x | 27.0x | 39.5x |
| PEG ratio | 1.28 | 1.71 | 3.70 |
| Dividend yield | None | 0.73% | 0.83% |
Valuation multiples and market values move with share prices and are shown at the date above. Source: StockAnalysis unless stated.
Amazon has the largest revenue of the three, slightly ahead of Walmart and more than double Microsoft’s. Its margins sit between the two, reflecting its mix of retail and cloud. It is the only one of the three with negative free cash flow over the last year, and it has the lowest return on invested capital and the largest net debt, both shaped by its capital spending. StockAnalysis’s free cash flow figure deducts gross capital spending, so it is a little lower than Amazon’s own US$(7.6) billion, and its net debt includes US$109.8 billion of lease liabilities. On forward earnings Amazon is priced in line with Microsoft and well below Walmart, and it has the lowest PEG ratio (price-to-earnings divided by expected growth).
Durability: the Lindy test
The Lindy effect suggests that the longer a business has survived, the longer it is likely to keep surviving. Amazon is 32 years old and has reinvented itself several times, from bookseller to everything store to cloud provider.
Key moments in Amazon’s history
- 1994 · Jeff Bezos founds the company in Bellevue, Washington, as Cadabra, renaming it Amazon months later.
- 1995 · The amazon.com website launches, selling books.
- 1997 · Initial public offering in May.
- 2006 · AWS launches its S3 storage service, and Fulfillment by Amazon opens the warehouse network to third-party sellers.
- 2017 · Acquires Whole Foods Market for US$13.7 billion.
- 2021 · Andy Jassy, who built AWS, succeeds Bezos as chief executive.
- 2023 · The US Federal Trade Commission and 18 states file an antitrust case; trial is expected in 2027.
- 2025 · Pays US$2.5 billion to settle FTC claims over Prime sign-ups and cancellations.
- 2026 · AWS growth reaches 37% in the June quarter, its fastest in 18 quarters, as AI demand outstrips capacity.
Three decades of survival through the dot-com crash, the 2008 financial crisis and the pandemic earn Amazon a high durability score. We stop short of the maximum because AWS, now the profit engine, is 20 years old, and the AI shift could change the cloud market faster than past cycles.
Profitability and cash flow
Operating margin rose from 2.6% in 2022 to 11.2% in 2025 and 12.1% over the last four quarters, helped by cost cuts in retail, a growing share of advertising and higher AWS margins.
Reported net income is a less reliable guide. Net income over the last four quarters was US$135.3 billion, well above operating income of US$93.7 billion, because Amazon recorded large gains on its investments in Anthropic. In the June 2026 quarter alone, other income was US$53.4 billion, which the company attributes mainly to Anthropic. These are paper revaluations, not cash from operations.
Annual free cash flow
US$ billions
US$ billions. Operating cash flow less gross purchases of property and equipment, per StockAnalysis. Amazon’s own measure, which deducts capital spending net of proceeds and incentives, was US$11.2 billion for 2025 and US$(7.6) billion for the year to June 2026.
View the data
| Value | |
|---|---|
| FY21 | −14.7 |
| FY22 | −16.9 |
| FY23 | 32.2 |
| FY24 | 32.9 |
| FY25 | 7.7 |
| TTM Jun 26 | −11.6 |
Operating cash flow is strong and rising, at US$161.4 billion over the last four quarters. Free cash flow has turned negative only because capital spending, mostly data centres, chips and power for AWS, reached US$169.0 billion net over the same period. Whether this spending earns good returns is the central question for the next few years.
Financial health: debt and cash
Amazon held US$123.0 billion of cash and marketable securities at 30 June 2026. Long-term debt rose to US$128.9 billion from US$65.6 billion six months earlier as the company borrowed to help fund its building program.
Including lease liabilities, StockAnalysis puts total debt at US$251.6 billion and net debt at US$128.6 billion. Against operating cash flow of US$161.4 billion a year, this is manageable, but the direction has changed: Amazon is now borrowing to invest rather than funding everything from cash flow.
Debt and cash at each quarter end
US$ billions
US$ billions. Debt includes long-term debt, its current portion and lease liabilities; cash includes short-term investments. Source: StockAnalysis quarterly balance sheet.
View the data
| Debt | Cash | |
|---|---|---|
| Sep 2024 | 158.5 | 88.1 |
| Dec 2024 | 155.4 | 101.2 |
| Mar 2025 | 158.0 | 94.6 |
| Jun 2025 | 159.6 | 93.2 |
| Sep 2025 | 160.4 | 94.2 |
| Dec 2025 | 178.5 | 123.0 |
| Mar 2026 | 235.5 | 143.1 |
| Jun 2026 | 251.6 | 123.0 |
Equity rose to US$551.6 billion at 30 June 2026, partly from the Anthropic gains. The balance sheet is sound, but a long stretch of negative free cash flow would push debt higher still.
Capital allocation and management
Amazon puts almost all its cash back into the business. Andy Jassy told investors on the July 2026 call that capital spending would total about US$220 billion in 2026, up from the US$200 billion planned in February, citing higher memory chip costs. Management says most of it supports AWS and AI, and that even this will not meet all demand.
Amazon does not pay a dividend and, according to StockAnalysis, has never paid one. It has not reported meaningful share buybacks in recent years, and shares outstanding rose from 10,731 million to 10,783 million in the first half of 2026, partly reflecting stock-based pay of US$19.3 billion over the last four quarters. The record of reinvesting, from AWS to the delivery network, has been strong, but the scale of today’s spending makes the returns harder to judge.
Strengths and risks at a glance
What stands out
Our checklist of the business’s main strengths and risks
Strengths
- AWS is a large, fast-growing and highly profitable cloud business, with 37% growth, a 39.4% operating margin and a reported US$496 billion backlog.
- Advertising is a fast-growing, high-margin line (US$19.8 billion in the quarter, up 26%) built on shopper data that few rivals have.
- A logistics network that delivers same-day and next-day at a scale that is very costly to replicate.
- Prime and the marketplace create a self-reinforcing loop of shoppers, sellers and selection.
- Operating cash flow of US$161.4 billion a year gives the company room to fund heavy investment.
Risks
- Capital spending of about US$220 billion in 2026 has pushed free cash flow negative; if AI demand cools, returns on these assets could disappoint.
- Reported earnings are inflated by investment gains on Anthropic, which can reverse if Anthropic’s value falls.
- Cloud competition from Microsoft and Alphabet is intense, particularly for AI workloads.
- The FTC antitrust case, due for trial in 2027, could force changes to marketplace and Prime practices.
- Retail margins remain thin (4.1% internationally), leaving profits exposed to consumer spending, tariffs and labour costs.
The case for and against the business
Both sides
The strongest arguments we can make each way about the business
The case for
Amazon owns two of the strongest franchises in business, a cloud platform growing faster than it has in years and a retail network that now carries a large advertising business. If the AI spending earns returns similar to past AWS investment, earnings could grow well into the next decade, and the backlog suggests demand is already contracted.
The case against
The company is spending more on capital projects than it generates from operations, borrowing to do so, and its headline profits are flattered by investment gains. If AI demand proves cyclical, or if chip and power costs keep rising, Amazon could be left with expensive assets earning lower returns, while regulators press on its retail business.
Our fair value estimate for Amazon
We value Amazon on its 2027 earnings per share (EPS). The anchor is the analysts’ consensus of US$10.45 from StockAnalysis. We cut this by 15% in our base case, because recent results include large investment gains and depreciation on the new data centres will rise. We then apply a price-to-earnings (P/E) multiple and discount the result back from the end of 2027 to today at 10% a year.
On these assumptions our base case is about US$206 a share, below the US$262.45 share price at the close on 19 October 2026. The range runs from US$140 in a bear case to US$298 in a bull case. This is our estimate, an opinion that may prove wrong, and a higher multiple or faster AWS growth would lift it.
Lindy Capital fair value estimate · Amazon.com, Inc.
Overvalued on our estimate
The share price is 27% above our fair value estimate. Shaded bands sit 20% either side of our base-case estimate; the striped strip shows the range of our scenarios.
| Scenario | FY2027 EPS | P/E applied | Fair value today |
|---|---|---|---|
| Bear: consensus cut 25%, AI spending earns weak returns | US$7.84 | 20x | US$140 |
| Base: consensus cut 15% | US$8.88 | 26x | US$206 |
| Bull: consensus met, AWS growth stays high | US$10.45 | 32x | US$298 |
Fair value today = FY2027 EPS × P/E ÷ 1.10^1.2 (years from 19 October 2026 to 31 December 2027); EPS anchor is the StockAnalysis consensus of US$10.45.
Two traps when valuing Amazon
The trailing P/E looks cheap. A trailing P/E of 21.1 rests on EPS of US$12.44 that includes tens of billions of dollars of Anthropic revaluation gains. Analysts expect 2026 EPS of only US$8.31, so the business is more expensive than the trailing figure suggests.
Negative free cash flow can mislead both ways. Free cash flow is negative because of AI and data centre building, not weak operations. Valuing Amazon on today’s cash flow understates it if the spending pays off, but assuming it will pay off overstates it if demand fades.
Share price vs our fair value estimate
Weekly closing price over two years, with each fair value estimate from the date we published it. The shaded band is our bear-to-bull range.
First estimate published 25 October 2026. The dashed line shows the estimate in force; until we revise it, it is drawn across the whole period for comparison. Latest weekly price US$262.63. Prices from Yahoo Finance, refreshed daily. The estimate changes only when we revise it.
What we would watch
- AWS growth and operating margin each quarter, and whether the US$496 billion backlog keeps growing.
- Capital spending against the roughly US$220 billion 2026 plan, and early signs for 2027.
- Free cash flow returning to positive, and the path of debt.
- Size and direction of investment gains or losses on Anthropic in other income.
- The FTC antitrust trial expected in 2027 and any rulings on marketplace practices.
The short version
Amazon combines a durable retail and advertising network with a cloud business that is again growing quickly. Its advantages are wide and long-lived. The open question is price: the company is in the middle of the largest capital spending program in its history, and our conservative estimate of fair value sits below the current share price.
Frequently asked questions
What does Amazon do?
Amazon runs online and physical stores, a marketplace for independent sellers, an advertising business, the Prime subscription, and Amazon Web Services, which rents cloud computing to businesses. AWS earns most of its operating profit.
Does Amazon pay a dividend?
No. Amazon has never paid a dividend and reinvests its cash, mainly in data centres, AI chips and logistics.
How big is AWS?
AWS had revenue of US$42.2 billion in the June 2026 quarter, up 37% on a year earlier, and operating income of US$16.6 billion.
Why is Amazon’s free cash flow negative?
Capital spending, mostly on AWS data centres and AI capacity, reached US$169.0 billion over the year to June 2026, more than operating cash flow of US$161.4 billion. Management expects about US$220 billion of capital spending in 2026.
Is Amazon a buy?
We don’t make buy or sell recommendations. Our fair value estimate, set out above with its assumptions, is our opinion of what the business may be worth, not advice. Whether any investment suits you depends on your own circumstances, so speak to a licensed financial adviser.
Sources
- Amazon Q2 2026 earnings release (8-K exhibit 99.1)
- Amazon Form 10-Q for the quarter ended 30 June 2026
- Amazon Q4 2025 earnings release (Business Wire)
- StockAnalysis: AMZN statistics
- StockAnalysis: AMZN forecast
- StockAnalysis: AMZN dividend
- StockAnalysis: AMZN income statement
- StockAnalysis: AMZN cash flow statement
- StockAnalysis: AMZN quarterly balance sheet
- StockAnalysis: MSFT statistics
- StockAnalysis: WMT statistics
- Q2 2026 earnings call transcript (VectorShift)
- AP via Manufacturing.net: Amazon to boost spending by US$20 billion
- Let’s Data Science: Amazon raises 2026 capex
- Axios: Amazon Prime FTC settlement
- Wikipedia: Amazon (company)
- Lindy Capital: Broadcom deep dive (format reference)
Disclosure: Lindy Capital may hold, buy or sell shares in Amazon.com (AMZN) at any time, without notice, and does not disclose its positions. This is a study of how a business works, not a recommendation to buy, sell or hold any security. Our fair value estimate is an opinion based on the assumptions stated with it, not a price target or a forecast of the share price. Company guidance and analysts’ estimates are shown as reported. Figures are from public filings and data providers and will date. Important information.