



Most people know the AI boom through one famous chip designer. Fewer know Broadcom, even though it now earns more from AI hardware in a single quarter than most semiconductor companies earn in a year. It is worth studying because it combines two things that rarely sit together: an engineering lineage that runs back to 1961, and one of the fastest-growing businesses in technology.
This deep dive explains what Broadcom does, how it makes money, where its competitive advantages come from, how strong its finances are and what could undo it. It is written the way we study any business: durability first, numbers second, price last. It ends with our fair value estimate and the assumptions behind it. None of it is a recommendation.
Broadcom at a glance
NASDAQ: AVGO · Palo Alto, California · CEO Hock Tan (since 2006) · Fiscal year ends around 1 November
Source: Broadcom quarterly results (Form 8-K). Margins are calculated from reported figures. Figures will date.
How we see the business, in one picture
Research houses often sum up a company with a few ratings. We find that useful for the business itself, so here is our summary of Broadcom’s characteristics. These are judgements about the quality and risks of the business, not a rating of the shares, and they say nothing about price.
Lindy business profile: Broadcom
Our assessment of business characteristics, scored 1 to 5. Not a rating of the shares or a recommendation.
Each score is explained in the sections below.
What does Broadcom do?
Broadcom designs chips and sells infrastructure software. It does not manufacture its own chips; like most designers, it relies on contract manufacturers such as TSMC. Its business falls into two reporting segments:
- Semiconductor solutions. Custom AI accelerators designed with individual customers, the Ethernet switching and routing chips that connect AI processors inside data centres, and a long tail of chips for broadband, Wi-Fi, smartphones, storage and industrial uses.
- Infrastructure software. VMware, which lets companies run and manage their own private cloud infrastructure, together with mainframe, security and automation software from earlier acquisitions of CA Technologies and Symantec’s enterprise business.
The balance between the two has shifted fast. In the same quarter a year earlier, software made up about 43% of revenue. In the quarter to 2 August 2026, AI chips alone were more than half.
Where the revenue came from, quarter to 2 August 2026
Share of US$29.6B total revenue
Other semiconductors = semiconductor solutions revenue (US$20.8B) less AI semiconductor revenue. Source: Broadcom Q3 FY26 results.
How fast Broadcom is growing
For most of the last decade Broadcom grew steadily, mostly by acquisition. Revenue rose from US$22.6 billion in fiscal 2019 to US$35.8 billion in fiscal 2023. The VMware acquisition lifted it to US$51.6 billion in fiscal 2024, and AI demand has driven almost everything since.
Broadcom annual revenue, fiscal 2019 to 2026
US$ billions. Fiscal 2026 combines three reported quarters with management’s guidance for the fourth.
Guidance is management’s expectation and may be missed. Source: Broadcom annual and quarterly results.
View the data
| Fiscal year | Revenue (US$B) |
|---|---|
| 2019 | 22.6 |
| 2020 | 23.9 |
| 2021 | 27.5 |
| 2022 | 33.2 |
| 2023 | 35.8 |
| 2024 | 51.6 |
| 2025 | 63.9 |
| 2026: 9 months reported | 71.1 |
| 2026: Q4 guidance | 34.8 |
The AI business
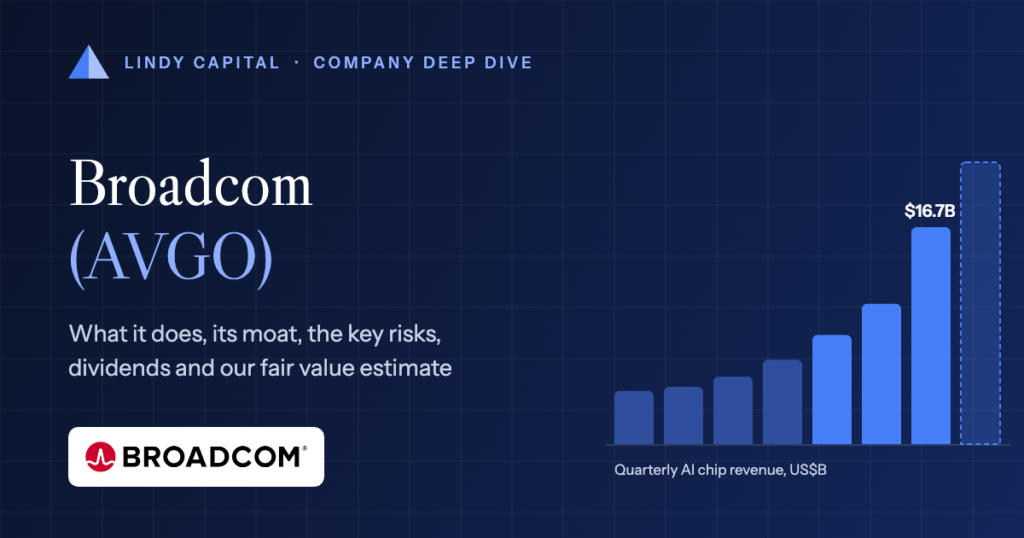
AI semiconductor revenue has roughly quadrupled in six quarters, from US$4.1 billion in the first quarter of fiscal 2025 to US$16.7 billion in the third quarter of fiscal 2026. Management has guided to US$21.7 billion for the fourth quarter.
Quarterly AI semiconductor revenue
US$ billions, by fiscal quarter
Fiscal 2025 quarters as reported by Broadcom; consistent with the year-on-year growth rates disclosed in fiscal 2026 results.
View the data
| Quarter | AI revenue (US$B) |
|---|---|
| Q1 FY25 | 4.1 |
| Q2 FY25 | 4.4 |
| Q3 FY25 | 5.2 |
| Q4 FY25 | 6.5 |
| Q1 FY26 | 8.4 |
| Q2 FY26 | 10.8 |
| Q3 FY26 | 16.7 |
| Q4 FY26 guidance | 21.7 |
The software business
Software has been steadier but lumpier. Infrastructure software revenue grew 1% year on year in the first quarter of fiscal 2026, 9% in the second and 29% in the third, to US$8.8 billion. Broadcom has moved VMware customers from perpetual licences to bundled subscriptions, chiefly VMware Cloud Foundation, which raises recurring revenue but has also raised prices for many customers.
How Broadcom makes money
Custom accelerators. The largest cloud and AI companies want chips tuned to their own models rather than general-purpose graphics processors. Broadcom co-designs these chips, often called XPUs, with each customer. Its best-known partnership is with Google on its Tensor Processing Units, and in October 2025 Broadcom and OpenAI announced a multi-year collaboration on custom accelerators. Broadcom contributes the hard parts that customers rarely want to build themselves: high-speed connections between chips, advanced packaging and the path to manufacturing.
AI networking. Training a large model means moving huge volumes of data between thousands of processors. Broadcom’s Tomahawk and Jericho switching chips have led the merchant Ethernet market for years, and as clusters grow from thousands to hundreds of thousands of processors, the network matters as much as the chips it connects.
Everything else in semiconductors. Broadband, wireless, storage and industrial chips are mature, cyclical businesses. They contribute cash and customer relationships but little growth.
Software subscriptions. VMware and the older software franchises sell multi-year subscriptions to large enterprises and governments. This revenue is recurring, very high margin and much less cyclical than chips.
The moat: where the advantage comes from
A moat is whatever lets a business earn high returns for a long time despite competition. Analysts often group moats into five sources. Broadcom draws on three of them strongly.
Sources of competitive advantage
Our assessment of which classic moat sources apply to Broadcom
| Moat source | Applies? | Where it shows up |
|---|---|---|
| Switching costs | Strong | Multi-year custom chip roadmaps; VMware embedded in enterprise data centres |
| Intangible assets | Strong | Decades of patents and know-how in high-speed connectivity and packaging |
| Cost advantage and scale | Strong | Volume with manufacturers; spreading huge R&D budgets across products |
| Network effects | Limited | Ethernet standards and ecosystems help, but this is not a true network effect |
| Efficient scale | Partial | Niche chip markets too small to attract many competitors |
The most important is switching costs. Once a customer is several generations into a custom chip roadmap, changing partners mid-stream is slow, risky and expensive. VMware has a similar quality: replacing it means re-platforming thousands of workloads, which most organisations would rather pay more than attempt. Broadcom has tested that tolerance with significant price and licensing changes since the 2023 acquisition.
Customers and competition
Broadcom’s AI revenue comes from a small number of very large customers, mostly hyperscale cloud providers and AI labs. That concentration cuts both ways: each relationship is deep and long-lived, but each one matters enormously.
- Nvidia is the main alternative for AI computing, selling general-purpose processors and its own networking. Every dollar a customer spends on custom chips is a choice against Nvidia, and vice versa.
- Marvell, MediaTek and others compete for custom chip design work.
- Customers themselves are a competitor. The largest have their own chip teams and could take more of the design work in-house over time.
- In software, VMware competes with public cloud providers, open-source alternatives and Nutanix, among others.
How Broadcom compares with its peers
NVIDIA and Marvell are the two listed companies closest to Broadcom’s AI business: NVIDIA as the dominant seller of general-purpose AI processors and networking, Marvell as the other large designer of custom AI chips.
Broadcom against its closest chip peers
Figures from StockAnalysis at the close on 19 October 2026. GAAP margins; forward P/E uses analysts’ next-year earnings estimates.
| Measure | Broadcom AVGO | NVIDIA NVDA | Marvell MRVL |
|---|---|---|---|
| Market value | US$1.60T | US$5.24T | US$208B |
| Revenue, last 12 months | US$89.1B | US$303.0B | US$9.5B |
| Gross margin | 75.5% | 74.7% | 52.2% |
| Operating margin (GAAP) | 48.8% | 65.2% | 16.8% |
| Free cash flow margin | 44.2% | 41.9% | 18.3% |
| Return on invested capital | 30.7% | 92.0% | 6.9% |
| Net cash (net debt) | (US$35.4B) | US$23.6B | (US$1.4B) |
| Forward P/E | 19.3x | 18.0x | 42.0x |
| PEG ratio | 0.35 | 0.36 | 0.75 |
| Dividend yield | 0.8% | 0.5% | 0.1% |
Valuation multiples and market values move with share prices and are shown at the date above. Source: StockAnalysis.
Three things stand out. NVIDIA is more than three times Broadcom’s size, earns higher operating margins and returns on capital, and holds net cash, while Broadcom carries acquisition debt. Broadcom converts slightly more of its revenue into gross profit and free cash flow, and on forward earnings the two trade on similar multiples. Marvell is a fraction of Broadcom’s size, with much thinner margins and returns, and its shares trade on more than twice Broadcom’s forward multiple. Broadcom’s software business is the main difference from both: it lowers growth but adds steadier, high-margin revenue that neither peer has.
Durability: the Lindy test
The Lindy effect suggests that the longer something has survived, the longer it is likely to keep surviving. Broadcom’s history is long, but it is a history of reinvention rather than continuity.
From HP’s chip division to AI infrastructure
Key moments in Broadcom’s history
- 1961 · Hewlett-Packard begins making semiconductors.
- 1999 · The chip business moves to Agilent in HP’s spin-off.
- 2005 · Sold to private equity and renamed Avago Technologies. Hock Tan becomes CEO in 2006.
- 2009 · Avago lists on Nasdaq.
- 2016 · Buys Broadcom Corporation for about US$37 billion and takes its name.
- 2018 · Buys CA Technologies for about US$18.9 billion.
- 2019 · Buys Symantec’s enterprise security business for about US$10.7 billion.
- 2023 · Completes the VMware acquisition, valued at about US$69 billion including assumed debt.
- 2024–26 · AI chips become the largest part of the business.
The engineering capabilities and the software franchises pass the test comfortably. The AI business does not yet. It is only a few years old, depends on a handful of customers, and has never been through a downturn in AI spending. That is why we score durability as mixed: a business can be excellent and still too young to call durable.
Profitability and cash flow
Broadcom is unusually profitable for a hardware company. In the third quarter of fiscal 2026 its adjusted (non-GAAP) operating margin was about 68%, and GAAP net income was US$13.1 billion, or 44% of revenue. Free cash flow, the cash left after running the business and investing in it, has grown every year since fiscal 2019.
Annual free cash flow
US$ billions, fiscal years
Fiscal 2025 free cash flow was 42% of revenue. In the first nine months of fiscal 2026 it was US$31.9B. Source: Broadcom annual results.
View the data
| Fiscal year | Free cash flow (US$B) |
|---|---|
| 2019 | 9.3 |
| 2020 | 11.6 |
| 2021 | 13.3 |
| 2022 | 16.3 |
| 2023 | 17.6 |
| 2024 | 19.4 |
| 2025 | 26.9 |
Fiscal 2024 shows why reported profit can mislead with this company. GAAP net income that year was only US$5.9 billion, depressed by VMware acquisition charges and tax items, while free cash flow was US$19.4 billion. In fiscal 2025 net income recovered to US$23.1 billion. For a serial acquirer, cash flow is usually the more honest guide, though the cost of the acquisitions themselves must still be counted.
Financial health: debt and cash
Acquisitions have been funded partly with debt. At the end of fiscal 2025 Broadcom had US$65.1 billion of debt and US$16.2 billion of cash. Strong cash generation has since reduced net debt quickly.
Debt and cash at each quarter end
US$ billions
Total bar height = total debt. Net debt fell from US$49.0B to US$35.4B in nine months. Source: Broadcom quarterly results.
View the data
| Quarter end | Total debt | Cash | Net debt |
|---|---|---|---|
| Nov 2025 | 65.1 | 16.2 | 49.0 |
| Feb 2026 | 66.1 | 14.2 | 51.9 |
| May 2026 | 64.9 | 19.6 | 45.3 |
| Aug 2026 | 59.4 | 24.0 | 35.4 |
With free cash flow of US$31.9 billion in the first nine months of fiscal 2026 alone, that debt load looks manageable. The bigger balance sheet question is what Broadcom does next: its history suggests another large acquisition is always possible, and a deal on the scale of VMware would add debt again.
Capital allocation and management
Hock Tan has run the company since 2006 with a consistent playbook: buy established franchises with loyal customers, cut costs hard, focus on the largest customers, and return a large share of the cash. In fiscal 2025 Broadcom paid US$11.1 billion in dividends and spent US$2.5 billion on share buybacks, and it has set a fiscal 2026 dividend of US$2.60 per share, paid quarterly.
The record is strong, but it rests heavily on one leader, and the acquisition model depends on finding the next franchise at a sensible price. Both are reasons we score capital allocation highly but not perfectly.
Dividends: rate, history and growth
Broadcom has raised its dividend every year since it began paying one in 2011, usually announcing the increase with its fourth-quarter results in December. The yield is low because the share price has risen much faster than the dividend, not because the dividend is small: Broadcom paid out US$11.1 billion in fiscal 2025.
Dividend at a glance
Share price as at 18 November 2026, refreshed daily
Yield and earnings payout are our calculations from the share price and analysts’ average estimate. They change as the price and estimates change.
Growth has slowed from the very large increases of 2018 and 2019, when cash flow was surging after acquisitions, to a steady 10% to 14% a year since. The dividend has cost a little under half of free cash flow in most years, which leaves room for debt repayment, buybacks and the next acquisition.
Annual dividend per share, fiscal 2018 to 2026
US$, adjusted for the 10-for-1 share split in July 2024. Each year’s rate is the quarterly dividend set in December × 4.
Bottom row: increase on the previous year. Source: Broadcom quarterly results and dividend announcements.
View the data
| Fiscal year | Quarterly (US$) | Annual (US$) | Increase |
|---|---|---|---|
| 2018 | 0.175 | 0.70 | – |
| 2019 | 0.265 | 1.06 | 51% |
| 2020 | 0.325 | 1.30 | 23% |
| 2021 | 0.36 | 1.44 | 11% |
| 2022 | 0.41 | 1.64 | 14% |
| 2023 | 0.46 | 1.84 | 12% |
| 2024 | 0.525 | 2.10 | 14% |
| 2025 | 0.59 | 2.36 | 12% |
| 2026 | 0.65 | 2.60 | 10% |
How much free cash flow goes out as dividends
US$ billions. Full bar = free cash flow; dark part = dividends paid.
Source: Broadcom annual results (cash flow statements, Form 8-K).
View the data
| Fiscal year | Free cash flow | Dividends paid | Payout |
|---|---|---|---|
| 2021 | 13.3 | 6.2 | 47% |
| 2022 | 16.3 | 7.0 | 43% |
| 2023 | 17.6 | 7.6 | 43% |
| 2024 | 19.4 | 9.8 | 51% |
| 2025 | 26.9 | 11.1 | 41% |
Two things matter for the dividend’s future: whether free cash flow keeps growing with the AI business, and whether another large acquisition takes priority over raises. The dividend is set by the board each quarter and is not guaranteed.
Strengths and risks at a glance
What stands out
Our checklist of the business’s main strengths and risks
Strengths
- Sits at two chokepoints of AI infrastructure: custom accelerators and networking
- Free cash flow above 40% of revenue
- High switching costs in both chips and software
- Net debt falling quickly
- Long record of disciplined operation
Risks
- A handful of customers drive most AI revenue
- AI spending could slow, and chip cycles are often violent
- Customers may take chip design in-house
- VMware price rises are straining customer goodwill
- Heavy reliance on one CEO and on acquisitions
The case for and against the business
Both sides
The strongest arguments we can make each way about the business, not the shares
The case for
Broadcom provides the parts of AI infrastructure its customers find hardest to build, under multi-year relationships that are costly to unwind. It converts nearly half its revenue into free cash flow, and its software business adds recurring, less cyclical earnings. If AI infrastructure spending keeps compounding, few companies are better placed.
The case against
The AI business is young, concentrated and exposed to the spending plans of a few customers who also have every reason to reduce their dependence on suppliers. Semiconductor booms have historically ended in gluts. The software franchise is being priced aggressively, and the whole model relies on one exceptional operator.
Our fair value estimate for Broadcom
We value Broadcom on the earnings we think it can make in fiscal 2028, then discount that value back to today at 10% a year. Management has said it expects non-GAAP earnings per share above US$30 in fiscal 2028. Our base case assumes US$27, a 10% haircut that reflects customer concentration and the youth of the AI business, valued at 20 times earnings. Our bear case assumes AI spending slows and earnings stall near US$18 a share, valued at 16 times. Our bull case assumes US$33 a share at 24 times.
Our base-case estimate of US$446 a share equals about 23 times analysts’ average forecast of fiscal 2027 earnings. It is an opinion built on assumptions that may prove wrong, and the range between our bear and bull cases is wide for a reason.
Lindy Capital fair value estimate · Broadcom Inc.
Undervalued on our estimate
The share price is 21% below our fair value estimate. Shaded bands sit 20% either side of our base-case estimate; the striped strip shows the range of our scenarios.
| Scenario | FY2028 EPS | P/E applied | Fair value today |
|---|---|---|---|
| Bear: AI spending slows | US$18 | 16x | US$238 |
| Base | US$27 | 20x | US$446 |
| Bull | US$33 | 24x | US$655 |
Fair value today = fiscal 2028 non-GAAP EPS × P/E, discounted two years at 10% a year. Management expects fiscal 2028 EPS above US$30 (Q3 FY2026 earnings call). Analysts’ average fiscal 2027 EPS forecast is US$19.40 (StockAnalysis, October 2026). The share price is the latest Nasdaq close and is refreshed daily; the estimate itself was set on 20 October 2026 and changes only when we revise it.
Two traps when valuing Broadcom
Reported profit can understate cash earnings. Large acquisitions create charges for amortising acquired intangible assets. These reduce GAAP profit without using cash, so headline price-to-earnings ratios can make an acquirer look more expensive than its cash flows suggest.
Growth-adjusted ratios rest on forecasts. Measures such as the PEG ratio divide a price multiple by expected earnings growth. When forecasts call for extraordinary growth, the ratio can make almost any price look cheap. The real question is how confident we can be that growth from a few concentrated customers continues for years, and what the business is worth if it doesn’t. We would rather test the downside case first.
Share price vs our fair value estimate
Weekly closing price over two years, with each fair value estimate from the date we published it. The shaded band is our bear-to-bull range.
First estimate published 20 October 2026. The dashed line shows the estimate in force; until we revise it, it is drawn across the whole period for comparison. Latest weekly price US$351.60. Prices from Yahoo Finance, refreshed daily. The estimate changes only when we revise it.
What we would watch
- AI revenue growth, and the number of customers designing custom chips with Broadcom
- Whether major customers move chip design in-house or to competitors
- Software growth and renewal rates as VMware contracts come up for renewal
- Net debt, the share count and the size of any new acquisition
- Gross margins as custom chips, which carry lower margins than software, become a larger share of revenue
The short version
Broadcom is an old engineering franchise run by a disciplined, cash-focused operator that now sits at two chokepoints of AI infrastructure. The quality of the business is easy to see. Its durability is harder to judge, because the fastest-growing part is also the youngest and the most concentrated. That tension, rather than any single figure, is what makes it worth studying.
Frequently asked questions
What does Broadcom do?
Broadcom designs semiconductors and sells infrastructure software. Its chips include custom AI accelerators, data centre networking chips and chips for broadband, wireless and storage. Its software business is led by VMware, which companies use to run their own cloud infrastructure.
How much does Broadcom make from AI?
Broadcom reported AI semiconductor revenue of US$16.7 billion in the quarter to 2 August 2026, up 221% on a year earlier, and guided to US$21.7 billion for the following quarter.
How much did Broadcom pay for VMware?
The acquisition, completed in November 2023, was valued at about US$69 billion including assumed debt, paid in a mix of cash and Broadcom shares.
Who are Broadcom’s main competitors?
In AI computing, Nvidia is the main alternative. Marvell and MediaTek compete for custom chip design work, and large customers’ own chip teams are a growing competitor. In software, VMware competes with public cloud providers and alternatives such as Nutanix.
Is Broadcom a buy?
We don’t make buy or sell recommendations. Our fair value estimate, set out above with its assumptions, is our opinion of what the business may be worth, not advice. Whether any investment suits you depends on your own circumstances, so speak to a licensed financial adviser.
Sources
- Broadcom third quarter fiscal 2026 results, Form 8-K, SEC (2 September 2026)
- Broadcom second quarter fiscal 2026 results, Form 8-K, SEC
- Broadcom first quarter fiscal 2026 results, Form 8-K, SEC
- Broadcom fourth quarter and fiscal 2025 results, Form 8-K, SEC
- Earlier annual figures from Broadcom’s annual reports on Form 10-K.
- Dividend history: Broadcom fourth-quarter results and dividend announcements, including fiscal 2022 and fiscal 2023 results (Form 8-K, SEC)
- Fiscal 2028 EPS expectation: Broadcom management, third quarter fiscal 2026 earnings call (2 September 2026), as reported in Lighthouse Canton’s results recap
- Peer comparison: StockAnalysis statistics for AVGO, NVDA and MRVL (19 October 2026)
- Analyst average EPS estimates: StockAnalysis, Broadcom forecast (October 2026)
Disclosure: Lindy Capital may hold, buy or sell shares in Broadcom (AVGO) at any time, without notice, and does not disclose its positions. This is a study of how a business works, not a recommendation to buy, sell or hold any security, Our fair value estimate is an opinion based on the assumptions stated with it, not a price target or a forecast of the share price. Company guidance is shown as reported by Broadcom. Figures are from Broadcom’s public filings and will date. Important information.