



Few listed companies have a past as uneven as Vistra’s. Its power plants and the TXU Energy brand trace back to Dallas in 1882, yet the company itself only emerged in 2016 from the bankruptcy of its former parent, Energy Future Holdings. Today it owns about 44,000 megawatts of generating capacity and sells electricity to about 5 million customers.
This study looks at what Vistra does, how it makes money, how durable that is, and what the balance sheet and cash flows look like for a business that must keep spending heavily on its plants. It ends with our fair value estimate, which is an opinion built on assumptions. None of it is a recommendation.
Vistra at a glance
NYSE: VST · Irving, Texas · CEO Jim Burke (CEO since August 2022) · Fiscal year ends 31 December
Figures as at 19 October 2026 unless stated. Sources are listed at the end of the article. Figures will date.
How we see the business, in one picture
Our scores reflect a business with valuable, hard to replace plants and a disciplined management team, offset by commodity exposure, a large debt load and a short history as an independent company. A score of 5 is the strongest; these are judgements, not measurements.
Lindy business profile: Vistra
Our assessment of business characteristics, scored 1 to 5. Not a rating of the shares or a recommendation.
Each score is explained in the sections below.
What does Vistra do?
Vistra generates electricity and sells it, both wholesale into regional grids and directly to homes and businesses. It is an independent power producer, which means it is not a regulated utility with guaranteed returns: its profits depend on what power sells for, what fuel costs, and how well its plants run.
At the end of 2025 it owned 43,641 megawatts of capacity. About 62% was natural gas, 20% coal, 15% nuclear and 3% solar and batteries. Its retail arm serves about 5 million customers in 16 states and the District of Columbia, about 2.6 million of them in Texas.
- Retail. Sells electricity and natural gas to homes and businesses under brands including TXU Energy, Ambit, Dynegy, Homefield, Energy Harbor and U.S. Gas & Electric.
- Texas. Power plants in ERCOT, the Texas grid, including the Comanche Peak nuclear plant.
- East. Plants in the PJM, New England, New York and MISO markets, including the Beaver Valley, Perry and Davis-Besse nuclear plants bought with Energy Harbor in 2024.
- West. Plants in California’s CAISO market.
- Asset Closure. Decommissioning and cleaning up retired plants and mines; a cost centre, not a profit centre.
The mix is shifting from coal towards gas and contracted nuclear. Vistra plans to retire its remaining Illinois and Ohio coal plants by 2028 and convert two coal sites to gas, while it has added gas plants through the Lotus purchase in 2025 and the pending Cogentrix deal. The East segment, built largely on nuclear, has become the largest earner.
Where segment earnings came from, six months to 30 June 2026
Share of US$3.3B segment adjusted EBITDA, before corporate costs
We show adjusted EBITDA rather than revenue because Vistra’s segment revenue is distorted by hedging gains and losses and by sales between its own segments. The four segments sum to US$3,305 million; corporate costs of US$44 million bring ongoing operations adjusted EBITDA to US$3,261 million. Six months are used because Texas earnings are highly seasonal. Source: Vistra second quarter 2026 earnings release.
How fast Vistra is growing
Reported revenue rose from US$12.1 billion in 2021 to US$17.7 billion in 2025, about 10% a year. Part of that came from buying Energy Harbor in 2024 and the Lotus gas plants in 2025, rather than from the existing business.
Revenue is a weak guide for a power producer. It moves with gas and power prices, and with hedging marks that pass through the accounts. In the June 2026 quarter revenue fell to US$4.0 billion from US$4.3 billion, even as adjusted EBITDA rose 31%. Analysts’ average forecast on StockAnalysis is US$22.3 billion of revenue for 2026, which would be about 26% growth, helped by acquisitions.
Vistra annual revenue
US$ billions, fiscal years to 31 December
Source: StockAnalysis (Vistra financial statements); FY26 estimate is the analysts’ average shown on StockAnalysis at 16 October 2026.
View the data
| Revenue | |
|---|---|
| FY21 | 12.1 |
| FY22 | 13.7 |
| FY23 | 14.8 |
| FY24 | 17.2 |
| FY25 | 17.7 |
| FY26 est (estimate) | 22.3 |
The number management steers by: adjusted EBITDA
We chose adjusted EBITDA (earnings before interest, tax, depreciation and amortisation, excluding hedging marks and one-off items) because it is how Vistra sets guidance and how its contracts, hedges and acquisitions show up most clearly. It strips out the large unrealised hedging gains and losses that make reported profit jump around.
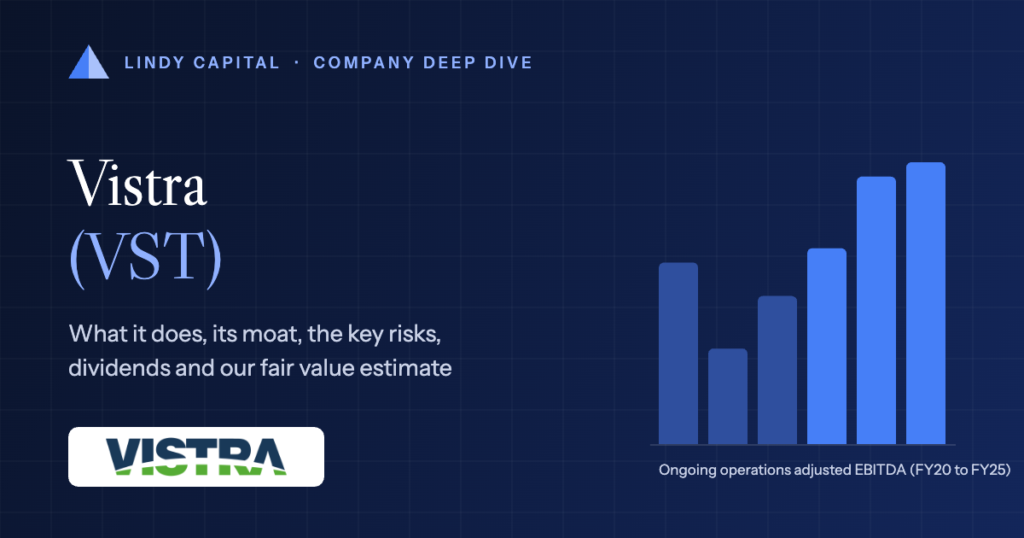
Ongoing operations adjusted EBITDA fell to about US$2.0 billion in 2021, the year Winter Storm Uri froze much of Texas and Vistra lost money. It has since roughly tripled to US$5.9 billion in 2025, helped by the Energy Harbor nuclear plants and higher power prices. Guidance for 2026 is US$6.8 to 7.6 billion, before the Cogentrix plants and the Meta contracts.
The longer-term driver is contracts with technology companies. In September 2025 Vistra signed a 20-year agreement to supply up to 1,200 megawatts from Comanche Peak, later identified as being with AWS, with deliveries from late 2027. In January 2026 it signed 20-year agreements with Meta for more than 2,600 megawatts from its three PJM nuclear plants, including 433 megawatts of planned uprates (upgrades that raise a plant’s output). Financial terms were not disclosed.
Ongoing operations adjusted EBITDA
US$ billions, fiscal years to 31 December
Adjusted EBITDA is a non-GAAP measure defined by Vistra. Each year uses the most recent figure Vistra has published for it: FY20 from the FY2021 release, FY21 from the FY2022 release, FY22 from the FY2023 release, FY23 to FY25 from the FY2025 release (earlier releases showed slightly different figures after segment changes). Sources: Vistra earnings releases (SEC Form 8-K exhibits).
View the data
| Value | |
|---|---|
| FY20 | 3.8 |
| FY21 | 2.0 |
| FY22 | 3.1 |
| FY23 | 4.1 |
| FY24 | 5.6 |
| FY25 | 5.9 |
| FY26 guide (estimate) | 7.2 |
How Vistra makes money
Selling power from its plants. Its gas, nuclear and coal plants sell energy into wholesale markets. Profit is the gap between the power price and the cost of fuel and running the plant, so low-cost nuclear output earns the most when prices are high.
Hedging that gap in advance. Vistra sells much of its expected output forward. At 3 August 2026 it had hedged about 100% of expected 2026 generation, 94% of 2027 and 72% of 2028, which steadies near-term earnings but means today’s prices only show up gradually.
Retail electricity. TXU Energy and its other brands buy power largely from Vistra’s own plants and sell it to homes and businesses. Retail earns a margin per customer and acts as a natural hedge: when wholesale prices fall, generation earns less but retail costs fall too.
Capacity payments. In markets such as PJM, plants are paid simply for being available when the grid needs them. These payments are one part of what the East segment earns; its adjusted EBITDA rose to US$1,443 million in the first half of 2026 from US$932 million a year earlier.
Long-term contracts with large buyers. The AWS and Meta agreements lock in 20-year sales from nuclear plants. They turn part of a commodity business into something closer to a contracted one, though the prices were not disclosed.
The moat: where the advantage comes from
Electricity is the same product whoever makes it, so a power producer’s moat (its lasting advantage over rivals) cannot come from the product. It comes from owning plants that are cheap to run, hard to replicate, and located where demand is growing.
Sources of competitive advantage
Our assessment of which classic moat sources apply to Vistra
| Moat source | Applies? | Where it shows up |
|---|---|---|
| Switching costs | Limited | Retail customers in Texas can switch provider easily. The 20-year AWS and Meta contracts create stickiness for a small part of output. |
| Intangible assets | Partial | Nuclear operating licences and grid connections are very hard to obtain. TXU Energy is a long-established brand in Texas. |
| Network effects | Limited | None of note; one more customer does not make the service better for others. |
| Cost advantage and scale | Partial | About 6,400 megawatts of existing nuclear plants run at low marginal cost, and a 44,000 megawatt fleet spreads fixed costs widely. Gas plants have no lasting cost edge. |
| Efficient scale | Partial | Building new nuclear plants takes many years, and new gas turbines are in short supply, which limits new competition in the near term. |
The strongest part of the moat is the nuclear fleet: plants that already exist, cannot easily be copied, and produce carbon-free power around the clock, which is what data centre buyers want. The rest of the business competes largely on price, so we score the moat as moderate.
Customers and competition
Vistra competes with other independent power producers in wholesale markets, and with many retailers for customers. In Texas, retail competition is open and price-driven.
- Constellation Energy (CEG) is the closest comparison. It owns about 31,700 megawatts of nuclear, gas, wind, solar and hydro capacity and also signs long-term deals with technology companies.
- NRG Energy (NRG) is Vistra’s main rival in Texas retail through brands such as Reliant and Green Mountain Energy, and also runs generation and the Vivint smart home business.
- New batteries and solar in Texas compete at peak times. Vistra’s CFO said in October 2026 that 2027 ERCOT forward prices were meaningfully lower than a year earlier, partly as batteries were added.
- Technology companies themselves can sign with any generator, build their own supply, or delay projects; buyers have choices.
How Vistra compares with its peers
Constellation and NRG are the two largest listed US power producers most comparable with Vistra. The table uses StockAnalysis figures, which follow standard accounting definitions rather than each company’s adjusted measures.
Vistra against its closest listed peers
Figures at the close on 19 October 2026. GAAP margins unless stated; forward P/E uses analysts’ next-year earnings estimates.
| Measure | Vistra VST | Constellation CEG | NRG Energy NRG |
|---|---|---|---|
| Market value | US$50.2B | US$93.3B | US$20.9B |
| Revenue, last 12 months | US$19.2B | US$31.3B | US$33.1B |
| Gross margin | 38.3% | 22.1% | 18.8% |
| Operating margin (GAAP) | 19.8% | 15.1% | 6.3% |
| Free cash flow margin | 11.7% | 0.9% | 1.1% |
| Return on invested capital | 9.7% | 7.4% | 6.2% |
| Net cash (net debt) | (US$20.1B) | (US$24.0B) | (US$23.3B) |
| Forward P/E | 14.8x | 21.3x | 9.6x |
| PEG ratio | 0.45 | 1.26 | 0.51 |
| Dividend yield | 0.61% | 0.65% | 1.91% |
Valuation multiples and market values move with share prices and are shown at the date above. Source: StockAnalysis unless stated.
On these trailing figures Vistra has the highest gross, operating and free cash flow margins of the three, and the highest return on invested capital. Its net debt is the smallest in dollars, though large relative to its US$50.2 billion market value. Its forward P/E sits between NRG’s lower multiple and Constellation’s higher one, and it has the lowest dividend yield of the three. Margins for all three swing with hedging and acquisitions, so one year’s figures should be read with caution.
Durability: the Lindy test
The Lindy effect suggests that things which have lasted a long time tend to keep lasting. Vistra is a mixed case: the plants, the customers and the TXU brand are old, but the company that owns them is ten years old and was born out of a bankruptcy.
Key moments in Vistra’s history
- 1882 · The Dallas Electric Lighting Company, an indirect predecessor of TXU Energy, begins supplying electric light in Dallas.
- 1945 · Texas Utilities is formed as a holding company over three Texas operating companies.
- 2002 · Texas opens its electricity market to retail competition; TXU Energy becomes a retail provider.
- 2007 · KKR, TPG and Goldman Sachs buy the group, renamed Energy Future Holdings, for about US$45 billion.
- 2014 · Energy Future Holdings files for Chapter 11 bankruptcy protection in April.
- 2016 · The generation and retail business emerges from bankruptcy on 3 October as Vistra Energy.
- 2018 · Vistra acquires Dynegy, adding plants across the Midwest and East.
- 2021 · Winter Storm Uri; Vistra reports a net loss of US$1.3 billion for the year.
- 2024 · Energy Harbor purchase adds 4,048 megawatts of nuclear capacity in PJM.
- 2025–26 · 20-year nuclear supply deals with AWS (up to 1,200 MW) and Meta (more than 2,600 MW); Cogentrix gas plants deal agreed.
The assets have survived more than a century of ownership changes, regulation and market redesign, which says something about the lasting need for what they produce. The company’s own record is short and includes a costly storm year. We score durability at 3: the demand is very durable, the corporate history much less tested.
Profitability and cash flow
Reported profit is a poor guide to Vistra’s year-to-year performance. Net income attributable to common shareholders was US$752 million in 2025 against US$2.5 billion in 2024, while adjusted EBITDA rose. The difference is mostly unrealised gains and losses on hedges for future years, which are recorded as prices move even though the cash has not changed hands.
Free cash flow needs equal care, because Vistra is capital intensive. It spends heavily on maintaining plants, buying nuclear fuel and on growth projects. We show two measures and label them clearly.
Conventional free cash flow is cash from operations minus all capital spending, as StockAnalysis calculates it. It was US$1.3 billion in 2025 (cash from operations of US$4.1 billion less US$2.8 billion of capital spending) and US$2.3 billion over the 12 months to June 2026. It was negative in 2021 and 2022, when the storm and collateral posted on hedges absorbed cash.
Adjusted free cash flow before growth (Adjusted FCFbG) is Vistra’s own measure. It starts from operating cash flow, excludes swings in working capital and margin deposits, and deducts only maintenance capital spending, not growth spending (US$1.1 billion in 2025). It was US$3.6 billion in 2025, and guidance for 2026 is US$3.9 to 4.7 billion. It is a fair view of the cash the existing fleet produces, but it is not cash left over after everything the company actually spends.
Ongoing operations adjusted free cash flow before growth
US$ billions
US$ billions. Vistra’s non-GAAP measure: excludes growth capital spending, working capital and margin deposit changes, and is before preferred dividends. Conventional free cash flow (operating cash flow less all capital spending, per StockAnalysis) was US$-1.2B (FY21), US$-0.8B (FY22), US$3.8B (FY23), US$2.5B (FY24) and US$1.3B (FY25). Sources: Vistra earnings releases; StockAnalysis.
View the data
| Value | |
|---|---|
| FY20 | 2.6 |
| FY21 | 0.2 |
| FY22 | 2.4 |
| FY23 | 2.5 |
| FY24 | 2.9 |
| FY25 | 3.6 |
Both measures point the same way: the fleet now produces several billion dollars of cash a year. The gap between them, about US$2.3 billion in 2025, is mostly growth spending, working capital and other adjustments. Investors who value Vistra on the adjusted figure are implicitly assuming that growth spending earns its keep.
Financial health: debt and cash
At 30 June 2026 Vistra had about US$20.5 billion of debt and US$435 million of cash, so net debt of about US$20.1 billion. That is roughly 3.0 times adjusted EBITDA over the past 12 months (US$6.6 billion), close to management’s long-term target of below 3 times.
Debt rose by about US$4.7 billion between September 2024 and June 2026 as Vistra paid for acquisitions while also buying back shares. It also has US$2.5 billion of redeemable preferred stock, which ranks ahead of ordinary shareholders and is not counted in the debt figure above. Liquidity was about US$6.3 billion, mostly undrawn credit lines.
Debt and cash at each quarter end
US$ billions
US$ billions; total debt and cash and equivalents. Excludes US$2.5 billion of redeemable preferred stock. Source: StockAnalysis quarterly balance sheets (from Vistra’s filings).
View the data
| Debt | Cash | |
|---|---|---|
| Sep 2024 | 15.8 | 0.9 |
| Dec 2024 | 18.7 | 1.2 |
| Mar 2025 | 17.7 | 0.6 |
| Jun 2025 | 18.1 | 0.5 |
| Sep 2025 | 18.9 | 0.6 |
| Dec 2025 | 21.0 | 0.8 |
| Mar 2026 | 20.6 | 0.6 |
| Jun 2026 | 20.5 | 0.4 |
The Cogentrix deal will add about US$1.5 billion of assumed debt, partly offset by earnings from the new plants. The debt is manageable while cash flows hold up, but a business exposed to power prices and extreme weather has less room for error than its adjusted figures suggest.
Capital allocation and management
Jim Burke became chief executive in August 2022, after nearly 20 years with Vistra and its predecessors, including running TXU Energy from 2005 to 2016. Under him Vistra has followed a clear plan: return a large share of cash to shareholders, and buy existing plants rather than build new ones from scratch where it can.
Vistra has repurchased about US$6.5 billion of shares since November 2021, cutting the share count by about 30% to about 336 million. It plans about US$300 million a year of dividends and at least US$1 billion a year of buybacks. Its acquisitions have been priced modestly: Cogentrix was agreed at about US$4.0 billion net, roughly 7.25 times expected 2027 adjusted EBITDA and about US$730 per kilowatt, paid partly with 5 million shares issued at US$185.
Newer bets carry more uncertainty. Vistra has committed up to US$1.0 billion to Helix Digital Infrastructure, a venture with KKR, the Kuwait Investment Authority and NVIDIA, in which it is the preferred power provider. It has also received a conditional US Energy Department loan commitment of up to US$4.2 billion for its Ohio and Pennsylvania nuclear plants. Buybacks have been made at much higher prices than today’s, and debt has risen alongside them.
Dividends: rate, history and growth
Vistra pays a small quarterly dividend that it has raised a little each quarter. Management frames the dividend as a fixed annual amount, about US$300 million, rather than a share of profit, and uses buybacks as the main way to return cash.
Dividend at a glance
Share price as at 18 November 2026, refreshed daily
Because the total dividend bill has stayed near US$300 million while the share count has fallen, dividends per share have grown faster than the payout itself, from US$0.60 in 2021 to US$0.90 in 2025. Growth has slowed recently to small quarterly steps of about US$0.001 per share.
Dividends per share
US$ per share by fiscal year; second value is dividends paid as % of conventional free cash flow
Payout percentages omitted for FY21 and FY22, when conventional free cash flow was negative. Source: StockAnalysis. Bottom row: payout ratio.
View the data
| Dividend per share (US$) | |
|---|---|
| FY21 | $0.60 |
| FY22 | $0.72 |
| FY23 | $0.82 |
| FY24 | $0.87 |
| FY25 | $0.90 |
Common dividends paid against conventional free cash flow
US$ billions
US$ billions. Free cash flow here is operating cash flow less all capital spending (StockAnalysis), not Vistra’s adjusted FCFbG. Preferred dividends (US$192M in 2025) are additional. Source: StockAnalysis cash flow statements.
View the data
| Dividends paid | Free cash flow | |
|---|---|---|
| FY21 | 0.3 | −1.2 |
| FY22 | 0.3 | −0.8 |
| FY23 | 0.3 | 3.8 |
| FY24 | 0.3 | 2.5 |
| FY25 | 0.3 | 1.3 |
Dividends were paid even in 2021 and 2022, when conventional free cash flow was negative, funded from borrowing and other cash. Today the dividend is a small claim on cash flow and looks well covered on either measure. As always, dividends are set by the board and are not guaranteed.
Strengths and risks at a glance
What stands out
Our checklist of the business’s main strengths and risks
Strengths
- About 6,400 megawatts of existing nuclear plants, which produce carbon-free power around the clock and would be very hard to replicate.
- 20-year supply agreements with AWS and Meta covering about 3,800 megawatts, which add long-term contracted revenue to a commodity business.
- Heavy forward hedging (about 94% of expected 2027 generation) that makes the next year or so of earnings more visible.
- An integrated retail business of about 5 million customers that partly offsets swings in wholesale prices.
- A record of shrinking the share count by about 30% since 2021 and buying plants at modest prices.
Risks
- Earnings depend on power and gas prices; Texas forward prices for 2027 have fallen as batteries and solar have been added.
- About US$20 billion of net debt plus US$2.5 billion of preferred stock, near management’s 3 times leverage limit.
- Extreme weather can be very costly, as Winter Storm Uri showed in 2021; the fire at its Moss Landing plant in January 2025 was another operational shock.
- Data centre demand may arrive later or smaller than hoped, and Texas has paused parts of its large-load connection review.
- Policy and market rules can change, including capacity market design in PJM, nuclear tax credits and coal plant regulation.
The case for and against the business
Both sides
The strongest arguments we can make each way about the business
The case for
Vistra owns scarce, low-cost nuclear plants at a time when large buyers are signing 20-year contracts for exactly that kind of power. Adjusted EBITDA has roughly tripled since 2021, near-term output is mostly hedged, and management has returned a large share of cash to shareholders. On the analysts’ 2027 estimate the shares trade at about 15 times earnings, and the midpoint of its 2026 adjusted FCFbG guidance equals about 8.6% of its market value.
The case against
Vistra is still a commodity business with a large debt load and a short, uneven history, including a bankruptcy and a storm year that wiped out profits. Its preferred cash measure leaves out growth spending, the value of the technology contracts is undisclosed, and Texas power prices have already softened. If data centre demand disappoints or power prices fall further, today’s earnings estimates may prove too high.
Our fair value estimate for Vistra
We value Vistra on earnings, because it is profitable and analysts’ forecasts are on an earnings basis. Our anchor is the analysts’ average estimate of US$10.21 per share for 2027 shown on StockAnalysis. We cut that by 10% in our base case to allow for weaker Texas power prices and the risk that new contracts ramp up slowly, apply a P/E of 16 times, and discount the result back to today at 10% a year over about 1.2 years.
That gives a base case of about US$131 per share, against a share price of US$149.70 at the close on 19 October 2026. Our bear case, with a 25% earnings cut and 12 times earnings, gives about US$82; our bull case, with the full estimate and 20 times earnings, gives about US$182. The range is wide because Vistra’s earnings depend on power prices. This is our opinion, built on assumptions that may prove wrong.
Lindy Capital fair value estimate · Vistra Corp.
Close to our estimate
The share price is within 20% of our fair value estimate (3% below). Shaded bands sit 20% either side of our base-case estimate; the striped strip shows the range of our scenarios.
| Scenario | FY2027 EPS | P/E applied | Fair value today |
|---|---|---|---|
| Bear: estimate cut 25% | US$7.66 | 12x | US$82 |
| Base: estimate cut 10% | US$9.19 | 16x | US$131 |
| Bull: full analyst estimate | US$10.21 | 20x | US$182 |
Fair value = FY2027 EPS (analysts’ average of US$10.21 from StockAnalysis, less our haircut) × P/E, discounted at 10% a year from 31 December 2027 to 19 October 2026 (about 1.2 years).
Two traps when valuing Vistra
Reported earnings swing with hedge marks. Unrealised hedging gains and losses can move quarterly net income by hundreds of millions of dollars, so a trailing GAAP P/E (about 25 times) can look very different from a forward one.
Adjusted free cash flow is not all spare cash. Adjusted FCFbG of US$3.6 billion in 2025 excluded US$1.1 billion of growth spending and was before US$192 million of preferred dividends; conventional free cash flow was US$1.3 billion. Valuing the shares on the adjusted figure alone can overstate what is left for shareholders.
Share price vs our fair value estimate
Weekly closing price over two years, with each fair value estimate from the date we published it. The shaded band is our bear-to-bull range.
First estimate published 2 November 2026. The dashed line shows the estimate in force; until we revise it, it is drawn across the whole period for comparison. Latest weekly price US$127.07. Prices from Yahoo Finance, refreshed daily. The estimate changes only when we revise it.
What we would watch
- Third quarter results due on 6 November 2026, including updated 2026 and 2027 guidance.
- Closing of the Cogentrix acquisition and its effect on debt and 2027 earnings.
- Progress on the Comanche Peak supply to AWS (deliveries from late 2027) and the first Meta deliveries from Perry, expected from December 2026.
- Texas forward power prices and the pace at which data centres connect to the ERCOT grid.
- Net debt relative to adjusted EBITDA, against the target of below 3 times.
The short version
Vistra is an old set of assets in a young company. Its nuclear plants have become prized by technology companies, its earnings have grown quickly, and management has been disciplined about buying plants and shares. Against that sit commodity prices, heavy debt and a history that includes a bankruptcy and a costly storm. Our base case fair value of about US$131 is below the current price, which reflects our caution on earnings in a business where prices can turn quickly.
Frequently asked questions
What does Vistra do?
Vistra generates electricity from about 44,000 megawatts of gas, coal, nuclear, solar and battery capacity and sells it wholesale and to about 5 million retail customers, including through TXU Energy in Texas.
Who are Vistra’s data centre customers?
Vistra has signed a 20-year agreement to supply up to 1,200 megawatts from Comanche Peak to AWS, and 20-year agreements with Meta for more than 2,600 megawatts from its Ohio and Pennsylvania nuclear plants. Prices were not disclosed.
What is adjusted free cash flow before growth?
It is Vistra’s own cash flow measure. It excludes growth capital spending and short-term swings in working capital and collateral. It was US$3.6 billion in 2025, against conventional free cash flow of US$1.3 billion.
Does Vistra pay a dividend?
Yes. It pays US$0.230 per share each quarter, or US$0.92 a year at the current rate, and plans about US$300 million of dividends a year alongside at least US$1 billion of buybacks.
Is Vistra a buy?
We don’t make buy or sell recommendations. Our fair value estimate, set out above with its assumptions, is our opinion of what the business may be worth, not advice. Whether any investment suits you depends on your own circumstances, so speak to a licensed financial adviser.
Sources
- Vistra second quarter 2026 earnings release (SEC 8-K)
- Vistra Form 10-Q, quarter ended 30 June 2026
- Vistra fourth quarter and full-year 2025 results
- Vistra Form 10-K, fiscal 2025
- Vistra full-year 2024 results (SEC 8-K exhibit 99.1)
- Vistra full-year 2023 results (SEC 8-K exhibit 99.1)
- Vistra full-year 2022 results
- Vistra full-year 2021 results (SEC 8-K exhibit 99.1)
- Vistra Cogentrix acquisition announcement (SEC 8-K exhibit 99.1)
- Vistra CEO succession announcement (SEC 8-K exhibit 99.1)
- Vistra: Vistra and Meta nuclear partnership
- ANS Nuclear Newswire: The Meta-Vistra deal
- World Nuclear News: Amazon and Meta agreements boost Vistra nuclear plants
- Power Engineering: Vistra secures long-term nuclear PPA from Comanche Peak
- TXU Energy: About us
- Wikipedia: Energy Future Holdings
- Wikipedia: Vistra Corp.
- TIKR: Vistra stock fell 6% in a day after a 20% run
- TIKR: Vistra stock is down 27% this year
- StockAnalysis: VST statistics
- StockAnalysis: VST forecast
- StockAnalysis: VST dividend
- StockAnalysis: VST financials
- StockAnalysis: VST quarterly financials
- StockAnalysis: VST cash flow statement
- StockAnalysis: VST quarterly balance sheet
- StockAnalysis: VST ratios
- StockAnalysis: CEG statistics
- StockAnalysis: CEG company profile
- StockAnalysis: NRG statistics
- StockAnalysis: NRG company profile
Disclosure: Lindy Capital may hold, buy or sell shares in Vistra (VST) at any time, without notice, and does not disclose its positions. This is a study of how a business works, not a recommendation to buy, sell or hold any security. Our fair value estimate is an opinion based on the assumptions stated with it, not a price target or a forecast of the share price. Company guidance and analysts’ estimates are shown as reported. Figures are from public filings and data providers and will date. Important information.