


Charles Schwab looks after US$13.33 trillion of other people’s money across about 40 million active brokerage accounts. It began as a small discount broker in San Francisco in the 1970s and now ranks among the largest wealth platforms in the United States, serving both individual investors and the independent advisers (RIAs) who manage money for their own clients.
This study looks at how Schwab makes money, what protects it, how sound its balance sheet is and what could go wrong. As always, we put durability first, the numbers second and price last. The study ends with our fair value estimate. None of it is a recommendation.
Schwab at a glance
NYSE: SCHW · Westlake, Texas · CEO Rick Wurster (CEO since January 2025) · Fiscal year ends 31 December
Figures as at 19 October 2026 unless stated. Sources are listed at the end of the article. Figures will date.
How we see the business, in one picture
We score the business on five measures from 1 to 5. These scores judge the quality and risk of the business, not the share price. Schwab scores highest on durability, having survived and grown through more than 50 years of market cycles. Predictability scores lowest, because about half of revenue depends on interest rates and on how much cash clients choose to leave idle.
Lindy business profile: Schwab
Our assessment of business characteristics, scored 1 to 5. Not a rating of the shares or a recommendation.
Each score is explained in the sections below.
What does Schwab do?
Schwab runs a brokerage, a bank and an asset manager under one roof. Individuals use it to buy shares, funds and bonds, hold cash and borrow against their portfolios. Independent advisers use it as a custodian, meaning Schwab holds and administers their clients’ assets while the adviser makes the investment decisions.
Schwab reports two segments, Investor Services (individual clients) and Advisor Services (RIAs), but the more useful view is by type of revenue. The bullets below use the four revenue lines from the September 2026 quarter.
- Net interest revenue. US$3.5 billion, 48.5% of the quarter’s revenue. The difference between what Schwab earns on client cash it invests (mostly in its bank) and on margin and bank loans, and what it pays clients on that cash.
- Asset management and administration fees. US$1.9 billion, 26.7%. Fees on Schwab’s own funds and ETFs, managed portfolios, advice services and third-party funds sold through its platform.
- Trading revenue. US$1.2 billion, 16.1%. Online share trades are commission-free, so this comes mostly from payment for order flow, options and futures commissions and bond mark-ups.
- Bank deposit account fees and other. US$0.6 billion, 8.7%. Fees from TD Bank for client cash swept to it under an agreement inherited with TD Ameritrade, plus other items.
The mix has been fairly stable. In FY2025, net interest revenue was 49.1% of revenue and asset management fees 27.2%, almost the same split as the latest quarter. What has changed is scale: revenue in the September 2026 quarter was 17% higher than a year earlier, with every line growing.
Where the revenue came from, quarter to 30 September 2026
Share of US$7.2B total net revenues
Values in US$ billions (three decimals so they sum to the US$7.171 billion total). Bank deposit account fees (US$345 million) and other revenue (US$279 million) combined. Source: Schwab Q3 2026 earnings release (8-K exhibit 99.1).
How fast Schwab is growing
Revenue rose from US$10.7 billion in FY2019 to US$23.9 billion in FY2025, a compound annual growth rate of about 14%. Much of that step-up came from buying TD Ameritrade in October 2020, which is why FY2021 is so much larger than FY2020.
The path was not smooth. Revenue fell in FY2023, when rising interest rates pushed clients to move idle cash into higher-yielding money market funds and Treasury bills, a process the industry calls cash sorting. Bank deposits fell from US$366.7 billion to US$290.0 billion that year.
Growth has since returned. Revenue for the nine months to September 2026 was US$20.7 billion, up 18%, and the 16 analysts surveyed by StockAnalysis expect about US$28.1 billion for FY2026.
Schwab annual total net revenues
US$ billions, fiscal years to 31 December
FY2020 includes TD Ameritrade from 6 October 2020. Sources: Schwab full-year earnings releases for 2020, 2022, 2023 and 2025; StockAnalysis forecast page (19 October 2026).
View the data
| Revenue | |
|---|---|
| FY19 | 10.7 |
| FY20 | 11.7 |
| FY21 | 18.5 |
| FY22 | 20.8 |
| FY23 | 18.8 |
| FY24 | 19.6 |
| FY25 | 23.9 |
| FY26 est (estimate) | 28.1 |
Client assets: the engine behind every revenue line
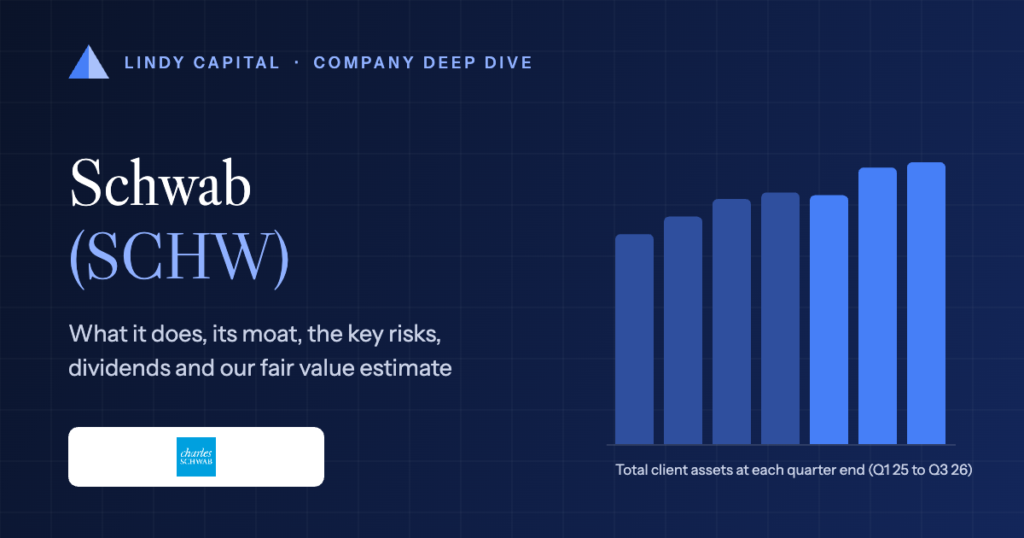
For a wealth platform, client assets play the role that sales volume plays elsewhere. Fees are charged on them, cash balances sit inside them and trading flows from them. Total client assets reached US$13.33 trillion at 30 September 2026, up 34% from US$9.93 trillion eighteen months earlier.
Two forces drive the figure: market movements, which Schwab does not control, and core net new assets, the money clients bring in minus what they take out. Core net new assets were a record US$190.4 billion in the September 2026 quarter, an annualised organic growth rate of 5.8%. Across the last four quarters they totalled US$614.1 billion, about 5.3% of client assets a year earlier.
The fall in the March 2026 quarter shows the market effect: Schwab still gathered US$140.0 billion of core net new assets, yet total client assets dipped, which points to lower asset prices over the quarter.
Total client assets at each quarter end
US$ trillions
Source: Schwab quarterly earnings releases (Q1 2025, Q2 2026 and Q3 2026, 8-K exhibit 99.1).
View the data
| Value | |
|---|---|
| Q1 25 | 9.9 |
| Q2 25 | 10.8 |
| Q3 25 | 11.6 |
| Q4 25 | 11.9 |
| Q1 26 | 11.8 |
| Q2 26 | 13.1 |
| Q3 26 | 13.3 |
How Schwab makes money
Earning a spread on client cash. Clients keep cash in their accounts between investments. Schwab sweeps much of it into its own bank (bank deposits were US$244.1 billion at 30 September 2026), pays clients a modest rate and invests it in securities and loans. The net interest margin was 3.00% in the June 2026 quarter.
Lending. Margin loans to investors (US$187.9 billion at quarter end) and bank loans, including Pledged Asset Lines secured against portfolios (US$37.3 billion, up 59% in a year), earn interest with the client’s assets as collateral.
Fees on assets. Schwab’s low-cost funds and ETFs, managed portfolios and advice services charge a percentage of assets. These fees grew 14% in the latest quarter, broadly in line with client assets.
Trading. Commission-free share trading is paid for by order-flow payments from market makers, plus commissions on options and futures. Trading revenue rises and falls with how active clients are.
Scale. A pre-tax margin above 50% reflects the advantage of spreading technology and compliance costs across trillions of dollars of assets.
The moat: where the advantage comes from
A moat is what stops competitors taking a company’s profits. Schwab’s comes mostly from scale and from how hard it is for advisers and investors to move.
Sources of competitive advantage
Our assessment of which classic moat sources apply to Schwab
| Moat source | Applies? | Where it shows up |
|---|---|---|
| Switching costs | Strong | Advisers run their whole practice on Schwab’s custody, trading and reporting systems; moving thousands of client accounts is slow, costly and risky. Individuals face paperwork and possible tax events. |
| Intangible assets | Partial | A trusted brand built over five decades, and a bank and broker licence stack that is hard to replicate. Trust matters when people hand over their savings. |
| Network effects | Limited | Some benefit from fund managers wanting to be on Schwab’s platform because the clients are there, but clients do not gain much from each other. |
| Cost advantage and scale | Strong | US$13.3 trillion of client assets lets Schwab offer commission-free trading and very low fund fees while keeping a pre-tax margin above 50%. |
| Efficient scale | Partial | US custody for independent advisers is dominated by a few large firms, and Schwab’s position grew after absorbing TD Ameritrade’s adviser business. |
The moat is real but not complete. Schwab cannot stop clients from moving cash to higher-yielding products, as 2023 showed, and competitors such as Interactive Brokers and Fidelity offer similar prices. The advantage lies in breadth: few rivals combine brokerage, banking, advice and adviser custody at this size.
Customers and competition
Schwab competes on several fronts at once: with brokers for self-directed investors, with custodians for advisers and with asset managers for fund flows.
- Fidelity Investments (private) is the closest all-round rival in brokerage, workplace retirement plans and adviser custody.
- Interactive Brokers (IBKR) appeals to active and international traders with low margin rates and global market access, and is growing accounts quickly.
- Robinhood (HOOD) competes for younger, mobile-first investors and has been moving into retirement accounts and advisory services.
- Vanguard (private) competes for long-term savers on fund costs.
- LPL Financial (LPLA) and the large wirehouses compete for advisers, the people who choose a custodian for their clients’ assets.
How Schwab compares with its peers
We compare Schwab with Interactive Brokers and LPL Financial. Interactive Brokers is the closest listed match as a broker that earns most of its revenue from interest on client cash and margin loans. LPL Financial is the largest listed platform for independent advisers, the market where Schwab’s Advisor Services segment competes, and it also earns heavily from client cash sweeps. Robinhood is a rival for younger investors but its business is still changing fast, so it is a weaker comparison. Free cash flow is not meaningful for brokers and banks, so we use pre-tax margin, return on equity and price-to-book instead.
Schwab against its closest listed peers
Figures at the close on 19 October 2026. GAAP margins unless stated; forward P/E uses analysts’ next-year earnings estimates.
| Measure | Schwab SCHW | Interactive Brokers IBKR | LPL Financial LPLA |
|---|---|---|---|
| Market value | US$154.9B | US$138.4B* | US$24.9B |
| Revenue, last 12 months | US$27.1B | US$7.1B | US$19.2B |
| Pre-tax margin | 51.1% | 78.5% | 7.1% |
| Return on equity | 21.1% | 23.7% | 18.6% |
| Price to book value | 3.1x | 6.0x | 4.4x |
| Trailing P/E | 15.7x | 31.6x | 25.6x |
| Forward P/E | 12.2x | 26.0x | 14.2x |
| PEG ratio | 0.60 | 1.14 | 0.58 |
| Dividend yield | 1.43% | 0.49% | 0.38% |
Valuation multiples and market values move with share prices and are shown at the date above. Source: StockAnalysis unless stated.
Interactive Brokers runs a leaner, more automated operation with a much higher pre-tax margin, and the market prices it at roughly twice Schwab’s earnings multiple. LPL’s low margin reflects its model: most of its revenue is passed on to the advisers who earn it, so margin comparisons with Schwab are not like for like. On forward earnings Schwab is the cheapest of the three, and it has the highest dividend yield. *Interactive Brokers’ market value counts all 1.70 billion IBG LLC membership interests at the US$81.35 close; StockAnalysis shows US$36.9 billion because it counts only the 453 million listed Class A shares. Other figures are from StockAnalysis.
Durability: the Lindy test
The Lindy effect says that the longer something has survived, the longer it is likely to keep surviving. Schwab has been in business for more than five decades and has grown through crashes, rate cycles and a near-complete change in how people trade.
Key moments in Schwab’s history
- 1963 · Charles Schwab starts an investment newsletter, the seed of the later firm.
- 1973 · The firm begins operating as a full investment brokerage.
- 1975 · US regulators end fixed commissions on 1 May; Schwab becomes a discount broker.
- 1987 · Schwab lists on the stock market.
- 1992 · Mutual Fund OneSource lets clients buy funds from many managers without transaction fees.
- 1996 · Schwab introduces web trading.
- 2003 · Charles Schwab Bank launches, the base of today’s net interest revenue.
- 2019 · Schwab eliminates online trading commissions.
- 2020 · Schwab acquires TD Ameritrade, closing in October.
- 2023 · Bank deposits fall from US$366.7 billion to US$290.0 billion as clients chase higher yields.
- 2025 · Rick Wurster succeeds Walt Bettinger as CEO on 1 January; client assets end the year at US$11.90 trillion.
The record is one of repeated adaptation: discount broking, fund supermarkets, online trading, zero commissions and a bank. The 2023 deposit outflow tested the model, and Schwab came through it profitably, though with a sharp drop in earnings. That history earns a high durability score, while reminding us that the business model has changed several times and will likely need to again.
Profitability and earnings
For a financial company, free cash flow says little, because lending and client cash flows swamp the cash figures. We look at pre-tax profit margin and earnings per share instead.
Schwab’s GAAP pre-tax margin was 45.2% in FY2019, fell to 36.8% in FY2020 (merger costs) and to 33.9% in FY2023 (cash sorting), then recovered to 47.9% in FY2025 and 51.3% for the nine months to September 2026. Diluted EPS has grown from US$2.67 in FY2019 to US$4.65 in FY2025, about 10% a year, with the dip in 2023 visible below.
Annual diluted earnings per share (GAAP)
US$ per share
US$ per share. Pre-tax margins (GAAP): FY19 45.2%, FY20 36.8%, FY21 41.6%, FY22 45.2%, FY23 33.9%, FY24 39.2%, FY25 47.9%. Sources: Schwab full-year earnings releases.
View the data
| EPS | |
|---|---|
| FY19 | 2.67 |
| FY20 | 2.12 |
| FY21 | 2.83 |
| FY22 | 3.50 |
| FY23 | 2.54 |
| FY24 | 2.99 |
| FY25 | 4.65 |
Earnings for the last four quarters were US$5.85 a share, and analysts expect about US$6.44 (adjusted) for FY2026. The swings show how much Schwab’s profit depends on interest rates and client behaviour around cash. Return on average common equity was 25% (annualised) in the September 2026 quarter.
Financial health: capital and cash
Banks and brokers are judged on capital, not debt. The Tier 1 leverage ratio compares high-quality capital with total assets. Schwab’s consolidated ratio was 8.9% at 30 September 2026 (preliminary), and the ratio at its bank subsidiary was 10.6%.
Schwab also reports an adjusted ratio that deducts unrealised losses on its securities portfolio, which were large after rates rose in 2022. On that basis the ratio was 7.0%.
Tier 1 leverage ratio, consolidated
Per cent
Per cent. First value: GAAP Tier 1 leverage ratio (preliminary); second: adjusted Tier 1 leverage ratio (non-GAAP). Quarters not shown were not disclosed in the releases we opened. Sources: Schwab quarterly earnings releases.
View the data
| GAAP | Adjusted | |
|---|---|---|
| Dec 2024 | 9.9% | 6.8% |
| Mar 2025 | 9.9% | 7.1% |
| Dec 2025 | 9.3% | 7.1% |
| Jun 2026 | 8.7% | 6.8% |
| Sep 2026 | 8.9% | 7.0% |
The ratio has eased as Schwab returned capital through buybacks, but it remains in a similar range to the past two years. The main balance-sheet risk is not debt but funding: if clients move cash out of bank sweeps quickly, Schwab must sell securities or borrow at higher rates, as it did in 2023. It has since cut that expensive supplemental funding to US$49.9 billion by December 2024, about half its peak.
Capital allocation and management
Rick Wurster became CEO on 1 January 2025 after Walt Bettinger, who remains Executive Co-Chairman alongside founder Charles Schwab. The succession was planned and announced in October 2024, which supports continuity.
Capital returns have stepped up sharply. Schwab bought back US$7.3 billion of shares in 2025, about 87% of net income available to common shareholders, and returned US$11.8 billion in all forms that year. It repurchased a further US$1.0 billion in the June 2026 quarter and US$0.5 billion in the September quarter. The TD Ameritrade deal has paid off in client assets and scale, but 2023 showed that the bank’s large holdings of long-dated securities left it exposed when rates rose.
Dividends: rate, history and growth
Schwab pays a quarterly dividend and raised it to US$0.32 a share in early 2026, 19% above the US$0.27 paid through 2025. Because Schwab is a financial company, we measure the payout against earnings rather than free cash flow.
Dividend at a glance
Share price as at 18 November 2026, refreshed daily
The payout ratio is low, at about a fifth of earnings, which leaves room for buybacks and for absorbing a weaker year. The ratio rose to 39.4% in FY2023 when earnings fell but the dividend was held at US$1.00, a sign the board treats the dividend as something to protect.
Dividends per share and payout ratio
US$ per share; payout ratio as % of diluted EPS
Payout ratio = dividends per share ÷ GAAP diluted EPS. Sources: StockAnalysis dividend and financials pages; Schwab earnings releases. Bottom row: payout ratio.
View the data
| Dividend per share (US$) | |
|---|---|
| FY21 | $0.72 |
| FY22 | $0.84 |
| FY23 | $1.00 |
| FY24 | $1.00 |
| FY25 | $1.08 |
Buybacks have been the larger part of capital returns. The dividend is modest but well covered, and its future growth will likely track earnings, which in turn depend on interest rates and client asset growth.
Strengths and risks at a glance
What stands out
Our checklist of the business’s main strengths and risks
Strengths
- Scale: US$13.33 trillion of client assets and about 40 million active brokerage accounts spread fixed costs thinly.
- Strong organic growth for a firm this size, with core net new assets of US$614.1 billion across the last four quarters.
- Sticky adviser relationships, as one of the largest US custodians for independent RIAs.
- High profitability, with a GAAP pre-tax margin of 52.7% in the latest quarter and return on equity above 20%.
- More than 50 years of adapting successfully to new technology, pricing and regulation.
Risks
- Interest rate sensitivity: net interest revenue is about half of revenue, and falling rates or another bout of cash sorting would squeeze it.
- Market dependence: fees and client assets fall when markets fall, as the March 2026 quarter showed.
- Price competition from Interactive Brokers, Fidelity, Vanguard and Robinhood keeps pressure on fees and cash yields.
- Regulatory risk, including scrutiny of how much brokers pay clients on sweep cash and of payment for order flow.
- Balance-sheet risk: unrealised losses on long-dated securities reduce adjusted capital, and a rapid cash outflow would force costly funding.
The case for and against the business
Both sides
The strongest arguments we can make each way about the business
The case for
Schwab has the scale, brand and adviser relationships to keep gathering assets at around 5% a year before market gains. Earnings have recovered strongly since 2023, the payout ratio is low, buybacks are large, and the shares trade at about 12 times forward earnings (StockAnalysis), less than half Interactive Brokers’ multiple.
The case against
Half of Schwab’s revenue is a bet on interest rates and on clients leaving cash idle. If rates fall or clients sort cash again, earnings could fall as they did in 2023. Record margins may mark a high point rather than a new normal, and competitors keep cutting prices.
Our fair value estimate for Schwab
We estimate what Schwab might earn per share in FY2027, apply a price-to-earnings multiple, and discount the result back to today at 10% a year (about 1.2 years to the end of 2027). Analysts’ consensus on StockAnalysis expects adjusted EPS of US$7.86 for FY2027. Our base case trims that by about 12% to US$6.90, allowing for the gap between adjusted and GAAP earnings and for lower interest rates, and applies 16 times, a moderate multiple for a high-quality but rate-sensitive financial firm.
On those assumptions our base case fair value is about US$98 a share, against a price of US$89.58 at the close on 19 October 2026. The bear case assumes earnings stall at the last four quarters’ US$5.85 and the multiple falls to 12 times, giving about US$63. The bull case assumes the consensus US$7.86 is met and the market pays 19 times, giving about US$133. These are our estimates, an opinion built on assumptions that may prove wrong.
Lindy Capital fair value estimate · The Charles Schwab Corporation
Close to our estimate
The share price is within 20% of our fair value estimate (6% below). Shaded bands sit 20% either side of our base-case estimate; the striped strip shows the range of our scenarios.
| Scenario | FY2027 EPS | P/E applied | Fair value today |
|---|---|---|---|
| Bear: earnings flat as rates fall | US$5.85 | 12x | US$63 |
| Base: consensus trimmed about 12% | US$6.90 | 16x | US$98 |
| Bull: consensus met | US$7.86 | 19x | US$133 |
Fair value = FY2027 EPS × P/E, discounted 1.2 years at 10% a year; the EPS anchor is StockAnalysis analysts’ consensus (US$7.86, adjusted) and the bear case uses trailing GAAP EPS.
Two traps when valuing Schwab
Record margins can flatter the multiple. A P/E of about 15 on peak earnings is not cheap if net interest revenue falls back. In FY2023 EPS dropped 27% in one year.
Adjusted figures are higher than GAAP. Consensus and adjusted EPS exclude acquisition amortisation and other items; Q3 2026 adjusted EPS was US$1.69 against GAAP US$1.62. Using adjusted numbers without a haircut overstates value.
Share price vs our fair value estimate
Weekly closing price over two years, with each fair value estimate from the date we published it. The shaded band is our bear-to-bull range.
First estimate published 21 October 2026. The dashed line shows the estimate in force; until we revise it, it is drawn across the whole period for comparison. Latest weekly price US$91.95. Prices from Yahoo Finance, refreshed daily. The estimate changes only when we revise it.
What we would watch
- Core net new assets each month and quarter, and whether organic growth holds near 5% a year.
- Transactional sweep cash (US$492.8 billion at September 2026 month end) and bank deposits, for signs of renewed cash sorting.
- Net interest margin as the US Federal Reserve changes rates.
- The adjusted Tier 1 leverage ratio and the pace of buybacks.
- Any regulatory action on sweep cash rates or payment for order flow.
The short version
Schwab is a durable, highly profitable wealth platform with five decades of adapting behind it and US$13.3 trillion of client assets today. Its weak spot is its dependence on interest rates and on client cash, which hurt it badly in 2023. Our base case fair value of about US$98 sits a little above the current price, with a wide range either side.
Frequently asked questions
What does Schwab do?
Schwab provides brokerage, banking, asset management and advice to individual investors, and custody and trading services to independent investment advisers. It held US$13.33 trillion of client assets at 30 September 2026.
How does Schwab make money if trading is free?
About half its revenue is net interest revenue, earned on client cash and loans. The rest comes mainly from fees on assets and from trading revenue such as order-flow payments and options commissions.
Why did Schwab’s earnings fall in 2023?
Rising interest rates led clients to move cash from low-yielding sweep accounts into money market funds and Treasuries. Bank deposits fell by about US$77 billion and Schwab had to use costlier funding, so EPS fell from US$3.50 to US$2.54.
Does Schwab pay a dividend?
Yes, US$0.32 a share each quarter, or US$1.28 a year. That is about a fifth of earnings.
Is Schwab a buy?
We don’t make buy or sell recommendations. Our fair value estimate, set out above with its assumptions, is our opinion of what the business may be worth, not advice. Whether any investment suits you depends on your own circumstances, so speak to a licensed financial adviser.
Sources
- Schwab Q3 2026 earnings release (8-K exhibit 99.1)
- Schwab Q3 2026 press release
- Schwab Q2 2026 earnings release (8-K exhibit 99.1)
- Schwab Q1 2025 earnings release (8-K exhibit 99.1)
- Schwab 4Q and full year 2025 results
- Schwab fourth quarter and full year 2024 results
- Schwab fourth quarter and full year 2023 results
- Schwab Q4 2022 earnings release (8-K exhibit 99.1)
- Schwab full year 2020 results
- Walt Bettinger to retire as CEO (Schwab press release)
- Schwab: Celebrating 50 years of innovation
- Interactive Brokers Q3 2026 results (8-K exhibit 99.1)
- StockAnalysis: SCHW statistics
- StockAnalysis: SCHW overview
- StockAnalysis: SCHW forecast
- StockAnalysis: SCHW dividend
- StockAnalysis: SCHW financials
- StockAnalysis: IBKR statistics
- StockAnalysis: IBKR overview
- StockAnalysis: LPLA statistics
- StockAnalysis: LPLA overview
Disclosure: Lindy Capital may hold, buy or sell shares in The Charles Schwab (SCHW) at any time, without notice, and does not disclose its positions. This is a study of how a business works, not a recommendation to buy, sell or hold any security. Our fair value estimate is an opinion based on the assumptions stated with it, not a price target or a forecast of the share price. Company guidance and analysts’ estimates are shown as reported. Figures are from public filings and data providers and will date. Important information.