




Meta Platforms owns Facebook, Instagram, WhatsApp and Messenger. On average, 3.64 billion people used at least one of them every day in September 2026. Almost all of Meta’s revenue comes from selling advertising across those apps, and the group earned an operating margin of 33% over the past year, even after a US$9.9 billion legal charge.
Meta is also in the middle of one of the largest investment programmes in corporate history. It expects to spend US$135 billion to US$145 billion on capital expenditure in 2026, mostly on data centres and chips for artificial intelligence. This study looks at the business, its moat, its finances and the risks of that bet, and ends with our fair value estimate. None of it is a recommendation.
Meta at a glance
NASDAQ: META · Menlo Park, California · CEO Mark Zuckerberg (co-founder; chairman and CEO since the company’s founding in 2004) · Fiscal year ends 31 December
Figures as at 23 October 2026 unless stated. Sources are listed at the end of the article. Figures will date.
How we see the business, in one picture
Our assessment of business characteristics, scored 1 to 5. Meta’s network of users and its advertising systems are among the strongest advantages in any listed company. We mark capital allocation and predictability lower because of the scale of AI spending, the long history of Reality Labs losses and the legal cases over young users, all of which make future profits harder to forecast.
Lindy business profile: Meta
Our assessment of business characteristics, scored 1 to 5. Not a rating of the shares or a recommendation.
Each score is explained in the sections below.
What does Meta do?
Meta builds apps that people use to communicate, share and pass time, and it sells advertising inside them. Facebook was founded in 2004 and the company renamed itself Meta Platforms in October 2021 to signal its push into virtual and augmented reality.
It reports two segments. Family of Apps holds the social and messaging apps and earns nearly all the revenue and profit. Reality Labs makes hardware and software such as Quest headsets and AI glasses, and it loses several billion dollars every quarter.
- Family of Apps: advertising. Ads shown in Facebook, Instagram, Messenger, WhatsApp and Threads, sold mostly through automated auctions. US$63.1 billion in the September 2026 quarter, 97.6% of revenue.
- Family of Apps: other revenue. Business messaging fees from WhatsApp, Meta Verified subscriptions and similar services. US$1.1 billion in the quarter, up from US$0.7 billion a year earlier.
- Reality Labs. Quest virtual reality headsets, AI glasses and related software. US$0.4 billion of revenue in the quarter against an operating loss of US$4.1 billion.
The mix has barely changed in a decade: advertising remains almost everything. What is shifting is the cost base. Meta is pouring money into AI models, data centres and AI researchers, betting that better AI will make its ads more effective and create new products, such as the Meta AI assistant and business messaging agents.
Where the revenue came from, quarter to 30 September 2026
Share of US$64.6B total revenue
Advertising and other revenue together make up the Family of Apps segment. Source: Meta third quarter 2026 earnings release.
How fast Meta is growing
Revenue grew from US$117.9 billion in 2021 to US$201.0 billion in 2025, a compound rate of about 14% a year. The path was not smooth: revenue fell 1.1% in 2022, when Apple’s privacy changes made ad targeting harder and advertisers cut budgets, before growth returned at 15.7% in 2023 and about 22% in each of 2024 and 2025.
Growth has stayed strong. Revenue rose 33% in the March 2026 quarter, 28% in the June quarter and 26% in the September quarter, to US$64.6 billion. Meta says ad impressions rose 10% and the average price per ad rose 14% in the September quarter, so both more ads and better-priced ads are contributing. Management guided to US$73 billion to US$76 billion of revenue for the December quarter, which would put 2026 revenue at about US$255 billion to US$258 billion, growth of roughly 27% to 28%.
Meta annual revenue
US$ billions, fiscal years to 31 December
Source: Meta annual results via StockAnalysis. FY26 is nine-month revenue of US$181.7 billion plus the midpoint of Meta’s December-quarter guidance of US$73–76 billion; it is an estimate, not a reported figure.
View the data
| Revenue | |
|---|---|
| FY21 | 118 |
| FY22 | 117 |
| FY23 | 135 |
| FY24 | 165 |
| FY25 | 201 |
| FY26 est (estimate) | 256 |
The AI spending bet
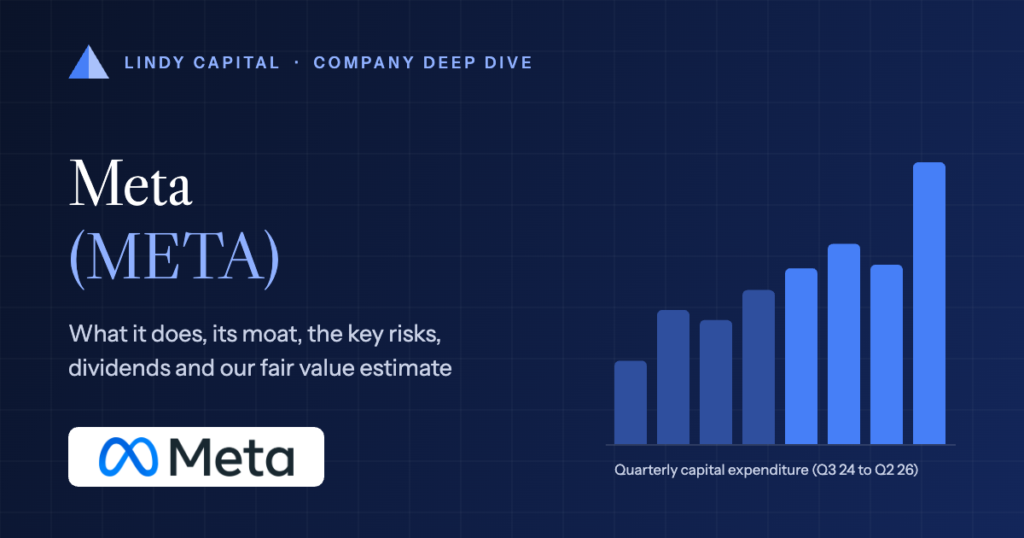
The single most important number for understanding Meta today is its capital expenditure, the money it spends on data centres, servers, chips and networking. Meta reports it including principal payments on finance leases. It rose from US$14.8 billion in the December 2024 quarter to US$34.9 billion in the September 2026 quarter, and the September figure alone equals 54% of that quarter’s revenue.
For the whole of 2026, Meta now expects US$135 billion to US$145 billion, against US$72.2 billion in 2025. The midpoint is close to double last year. Management has raised or narrowed the range at each update this year, citing higher component prices and extra data centre costs, and says its budget and capacity plan for 2027 are still being developed.
The spending already supports the ad business: Meta credits AI ranking and recommendation models with lifting engagement and ad prices. The open question is whether newer bets, such as Meta Superintelligence Labs and the Meta AI assistant, will earn a return on this scale of investment. The cost shows up first in free cash flow, which turned negative, at minus US$2.1 billion, in the September quarter, and later in depreciation, which will weigh on reported profits for years.
Quarterly capital expenditure, including finance lease principal
US$ billions
Purchases of property and equipment plus principal payments on finance leases. Source: Meta quarterly earnings releases (Form 8-K, exhibit 99.1). Full-year 2026 guidance is US$135–145 billion.
View the data
| Value | |
|---|---|
| Q4 24 | 14.8 |
| Q1 25 | 13.7 |
| Q2 25 | 17.0 |
| Q3 25 | 19.4 |
| Q4 25 | 22.1 |
| Q1 26 | 19.8 |
| Q2 26 | 31.1 |
| Q3 26 | 34.9 |
How Meta makes money
Targeted advertising. Businesses pay to show ads in Facebook and Instagram feeds, Stories and Reels. Meta’s systems decide which ad each user sees and price it through an auction, so revenue depends on the number of ads shown and the price advertisers will pay for each one.
Measurable results for small businesses. Millions of advertisers, many of them small, buy ads because Meta can show them sales or sign-ups directly linked to their spend. Automated tools let advertisers hand targeting and creative decisions to Meta’s AI.
Messaging. WhatsApp and Messenger earn fees when businesses message customers, plus click-to-message ads that open a chat. This is part of the US$1.1 billion of other revenue in the September quarter and is growing faster than advertising.
Hardware and software. Reality Labs sells Quest headsets and AI glasses. It earned US$2.2 billion of revenue in 2025 and lost US$19.2 billion, so for now it consumes profit rather than producing it.
The moat: where the advantage comes from
A moat is a lasting advantage that protects profits from competitors. Meta’s main advantage is the network effect: each app is more useful because so many friends, creators and businesses are already on it, and that audience in turn attracts advertisers.
Sources of competitive advantage
Our assessment of which classic moat sources apply to Meta
| Moat source | Applies? | Where it shows up |
|---|---|---|
| Network effects | Strong | 3.64 billion daily users; WhatsApp and Messenger are only useful because contacts use them, and advertisers follow the audience |
| Intangible assets | Strong | Data on what billions of people engage with, which trains ranking and ad models; brands such as Instagram and WhatsApp |
| Cost advantage and scale | Strong | Very few companies can fund US$135 billion or more of AI infrastructure in one year; scale spreads model costs across a vast user base |
| Switching costs | Partial | Users can leave easily, but they lose their contacts, photos and audience; advertisers lose tuned campaigns and measurement history |
| Efficient scale | Limited | Digital advertising is large and contested; TikTok, YouTube and Amazon compete for the same budgets |
The weakness is that attention can move. Young users switched time to Snapchat and then TikTok, and Meta had to respond by building Stories and Reels. The moat has held so far because Meta copied quickly and its ad system kept improving, but it depends on keeping people engaged rather than on contracts or regulation.
Customers and competition
Meta competes for two things: people’s time and advertisers’ budgets. Both are contested.
- Alphabet owns Google Search and YouTube and is the largest seller of digital advertising. YouTube competes directly with Reels for short video, and Alphabet also builds leading AI models.
- TikTok (owned by ByteDance, not listed) is the main rival for young users’ attention and the reason Meta built Reels.
- Amazon sells advertising on its shopping sites, close to the point of purchase, which appeals to the same performance-focused advertisers.
- Snap and Pinterest are smaller ad-funded social platforms. Snap also competes in augmented reality glasses.
- AI companies such as OpenAI compete for talent and for the future of how people find information, and Meta competes with them in AI assistants.
How Meta compares with its peers
We compare Meta with Alphabet, the other giant of digital advertising and an equally heavy AI spender, and with Pinterest. We chose Pinterest over Snap because it is also an ad-funded social platform, sells to many of the same advertisers, and is profitable on a GAAP basis, which makes margin comparisons more meaningful. The scale gap is very large, so read the ratios rather than the totals.
Meta against its closest listed peers
Figures at the close on 23 October 2026. GAAP margins unless stated; forward P/E uses analysts’ next-year earnings estimates.
| Measure | Meta META | Alphabet GOOGL | Pinterest PINS |
|---|---|---|---|
| Market value | US$1.64T | US$3.92T | US$12.9B |
| Revenue, last 12 months | US$241.6B | US$445.9B | US$4.6B |
| Gross margin | 81.0% | 60.9% | 79.5% |
| Operating margin (GAAP) | 32.9% | 33.1% | 6.3% |
| Free cash flow margin | 11.9% | 12.0% | 28.1% |
| Return on invested capital | 29.6% | 24.9% | 8.4% |
| Net cash (net debt) | (US$32.4B) | US$121.7B | US$0.1B |
| Forward P/E | 19.5x | 23.9x | 10.4x |
| PEG ratio | 1.02 | 1.83 | 0.39 |
| Dividend yield | 0.33% | 0.27% | None |
Valuation multiples and market values move with share prices and are shown at the date above. Source: StockAnalysis unless stated.
Meta has the highest gross margin and return on invested capital of the three. Its GAAP operating margin over the past year, reduced by a US$9.9 billion legal charge in the September quarter, is roughly level with Alphabet’s, and heavy AI spending has pulled both companies’ free cash flow margins well below their operating margins. Pinterest, which spends little on infrastructure, converts more of its revenue to cash. Alphabet holds substantial net cash, whereas Meta shows net debt once lease liabilities are included. Meta trades on a lower forward P/E than Alphabet but well above Pinterest, whose low multiple reflects slower expected growth and a smaller, less secure position.
Durability: the Lindy test
The Lindy effect suggests that the longer something has survived, the longer it is likely to keep surviving. Meta is 22 years old, young by Lindy standards, but it has already survived several threats that could have ended it.
Key moments in Meta’s history
- 2004 · TheFacebook is founded in Cambridge, Massachusetts by Mark Zuckerberg and four co-founders.
- 2012 · Facebook agrees to buy Instagram for about US$1 billion in April and lists on NASDAQ in May at US$38 a share, raising US$16 billion.
- 2014 · Buys WhatsApp and Oculus VR, the start of what became Reality Labs.
- 2021 · Renames itself Meta Platforms to reflect its bet on virtual and augmented reality.
- 2022 · Revenue falls for the first time after Apple’s privacy changes; in February the shares drop 27% in a day.
- 2023 · Cuts about 10,000 jobs in March in a push for efficiency.
- 2024 · Pays its first quarterly dividend.
- 2025 · Invests in Scale AI and forms Meta Superintelligence Labs; in November a US court rules for Meta in the FTC antitrust case.
- 2026 · Sets capital expenditure guidance of up to US$145 billion and cuts about 8,000 jobs in May; in October announces a new class of non-voting shares, to be issued as a one-for-one stock dividend.
Each crisis, from the shift to mobile to Apple’s privacy changes and the TikTok challenge, ended with Meta larger than before. That record earns credit, but two decades is short, and social apps have faded before. We score durability 4 out of 5 rather than 5.
Profitability and cash flow
The Family of Apps segment is extremely profitable. It earned US$102.5 billion of operating income in 2025 on US$198.8 billion of revenue. Reality Labs lost US$19.2 billion, equal to about 19% of the apps’ operating profit.
Margins came under heavier pressure in the September 2026 quarter. Operating income fell 37% to US$13.0 billion and the operating margin dropped to 20% from 40%, mainly because of a US$9.9 billion legal charge tied to an August 2026 agreement with 52 US state attorneys general over teen mental health claims. Without that charge, operating income would have been US$22.9 billion, a margin of about 35%. Research and development costs rose 32%, driven by AI staff and infrastructure.
Free cash flow, as Meta defines it (operating cash flow minus capital expenditure and finance lease principal), was US$43.6 billion in 2025, down from US$52.1 billion in 2024. In the September 2026 quarter it was negative US$2.1 billion, because US$34.9 billion of capital expenditure exceeded the US$32.8 billion of operating cash flow.
Annual free cash flow
US$ billions
US$ billions. Operating cash flow minus purchases of property and equipment, as calculated by StockAnalysis; Meta’s own definition also deducts finance lease principal (US$52.1 billion in FY24 and US$43.6 billion in FY25). TTM is the 12 months to 30 September 2026.
View the data
| Value | |
|---|---|
| FY21 | 39.0 |
| FY22 | 19.3 |
| FY23 | 44.1 |
| FY24 | 54.1 |
| FY25 | 46.1 |
| TTM | 28.7 |
The pattern matters for valuation. Reported earnings still look healthy, but cash generation is being squeezed by investment, and the depreciation on these assets will flow into the income statement over the next several years. Management has said it expects 2026 operating income, excluding the September-quarter legal charge, to exceed 2025’s, but has not promised margins will hold.
Financial health: debt and cash
Meta held US$82.5 billion of cash and marketable securities at 30 September 2026, against US$80.9 billion of long-term debt. Excluding leases, that leaves a small net cash position of about US$1.5 billion. Including lease liabilities, StockAnalysis puts total debt at US$114.8 billion and net debt at US$32.4 billion.
The direction is the point. Long-term debt was US$28.8 billion as recently as September 2025. Meta has since borrowed heavily to help fund data centres, and it has also used off-balance-sheet structures. In October 2025 it formed a joint venture with Blue Owl to fund the roughly US$27 billion Hyperion campus in Louisiana, holding 20% and agreeing to lease the facilities and guarantee the venture’s payments in some circumstances.
Debt and cash at each quarter end
US$ billions
US$ billions. Long-term debt (excluding leases) and cash, cash equivalents and marketable securities. Source: Meta quarterly earnings releases.
View the data
| Debt | Cash | |
|---|---|---|
| Dec 2024 | 28.8 | 77.8 |
| Jun 2025 | 28.8 | 47.1 |
| Sep 2025 | 28.8 | 44.5 |
| Dec 2025 | 58.7 | 81.6 |
| Mar 2026 | 58.7 | 81.2 |
| Jun 2026 | 83.7 | 90.3 |
| Sep 2026 | 80.9 | 82.5 |
Meta’s balance sheet remains strong, with large cash holdings and operating cash flow of US$32.8 billion in the September quarter alone. But it no longer has the fortress of net cash it held for most of its history, and lease commitments, joint venture guarantees and the attorneys general settlement, which allows for payments of up to about US$18.6 billion, add obligations that are easy to overlook.
Capital allocation and management
Mark Zuckerberg founded the company and controls it through Class B shares that carry extra votes, so outside shareholders cannot easily overrule him. That has let Meta make long, contrarian bets such as Instagram and WhatsApp, which proved outstanding, and Reality Labs, which has lost tens of billions of dollars without yet producing a large business.
Meta returned capital through buybacks of US$30.1 billion in 2024 and US$26.2 billion in 2025, plus dividends. It made no buybacks in the first nine months of 2026, as capital expenditure took priority. In October 2026 the board approved a new class of non-voting Class C shares, to be distributed as a one-for-one stock dividend once a charter change takes effect in 2027. Meta says the dividend does not change voting power, and it has signed an agreement with Mr Zuckerberg covering his sales of the new shares. The current bet on AI infrastructure is the largest in the company’s history, and whether it creates value will define this management team’s record.
Dividends: rate, history and growth
Meta began paying a quarterly dividend in March 2024, at US$0.50 a share. It raised it 5% to US$0.525 in 2025, and has paid US$0.525 in each quarter of 2026 so far. The dividend is small relative to earnings and cash flow.
Dividend at a glance
Share price as at 18 November 2026, refreshed daily
Because the payout is low, the dividend is well covered even in a year of heavy investment. It is not the main way Meta returns capital: buybacks were roughly five times larger than dividends in 2025. The absence of an increase so far in 2026 suggests the board is prioritising AI spending.
Dividends per share
US$ per share; payout as a share of diluted earnings per share
FY24 dividends of US$2.00 against diluted EPS of US$23.86; FY25 US$2.10 against US$23.49. Source: StockAnalysis and Meta earnings releases. Bottom row: payout ratio.
View the data
| Dividend per share (US$) | |
|---|---|
| FY24 | $2.00 |
| FY25 | $2.10 |
Dividends paid versus free cash flow
US$ billions
US$ billions. Dividends and dividend equivalents paid; free cash flow is operating cash flow minus purchases of property and equipment (StockAnalysis). Source: Meta earnings releases and StockAnalysis.
View the data
| Dividends paid | Free cash flow | |
|---|---|---|
| FY24 | 5.1 | 54.1 |
| FY25 | 5.3 | 46.1 |
With only two full years of history, Meta has no long dividend record. The payout is easily affordable, but investors should not expect it to grow quickly while capital expenditure is absorbing most operating cash flow.
Strengths and risks at a glance
What stands out
Our checklist of the business’s main strengths and risks
Strengths
- 3.64 billion people use its apps every day, an audience no competitor outside China matches.
- An exceptionally profitable advertising engine, with Family of Apps operating income of US$102.5 billion in 2025.
- Revenue grew 26–33% in each quarter of 2026, showing AI is already improving ad performance.
- The scale to fund AI infrastructure that few rivals can match.
- Large cash holdings and strong operating cash flow of US$32.8 billion in the September 2026 quarter.
Risks
- Capital expenditure of US$135–145 billion in 2026 may not earn an adequate return, and rising depreciation will weigh on future profits.
- Youth-related litigation in the US: after US$2.4 billion of legal charges in the June quarter, Meta took a US$9.9 billion charge in the September quarter for an agreement with 52 state attorneys general that allows payments of up to about US$18.6 billion, and more trials are scheduled.
- Regulation in the EU and elsewhere could restrict data use and ad targeting, as Apple’s privacy changes did in 2022.
- Reality Labs continues to lose about US$4–6 billion a quarter; Meta expects the loss to narrow to about US$15 billion in 2027, but there is no clear path to profit.
- Founder control through super-voting shares limits outside shareholders’ influence over spending decisions.
The case for and against the business
Both sides
The strongest arguments we can make each way about the business
The case for
The case for Meta is that it owns the world’s largest social audience and an advertising system that keeps getting better, with AI already helping keep revenue growth at 26–33% in 2026. If the AI investment improves ads further and creates new revenue in messaging and assistants, today’s spending could look cheap in hindsight, and the shares trade on a lower forward P/E than Alphabet.
The case against
The case against is that Meta is converting a cash-rich, capital-light business into a capital-heavy one, with free cash flow negative in the September quarter and debt far higher than a year ago. Legal costs over young users are mounting, Reality Labs keeps losing money, and Mr Zuckerberg’s control means shareholders must trust his judgement on spending that could prove excessive.
Our fair value estimate for Meta
Meta is highly profitable, so we value it on earnings. We start from analysts’ average forecast of US$34.63 earnings per share for 2027, shown on StockAnalysis, and assume only modest growth into 2028, below what recent revenue growth might suggest, because rising depreciation and legal costs could hold earnings back. We apply a price-to-earnings multiple to 2028 earnings and discount the result back two years at 10% a year. We reviewed these inputs after the September 2026 quarter results: the consensus 2027 forecast on StockAnalysis is unchanged at US$34.63, so our base case is unchanged.
Our base case uses EPS of US$36 and a P/E of 20, giving a fair value of about US$595 a share, roughly 7% below the closing price of US$642.62 on 23 October 2026. The bear case assumes the AI spending fails to lift earnings and legal and regulatory costs bite, with EPS of US$28 on a P/E of 15, giving US$347. The bull case assumes AI drives continued strong growth, with EPS of US$42 on a P/E of 24, giving US$833. This is our estimate, an opinion built on assumptions that may prove wrong.
Lindy Capital fair value estimate · Meta Platforms, Inc.
Close to our estimate
The share price is within 20% of our fair value estimate (3% above). Shaded bands sit 20% either side of our base-case estimate; the striped strip shows the range of our scenarios.
| Scenario | FY2028 EPS | P/E applied | Fair value today |
|---|---|---|---|
| Bear: AI spending fails to pay off | US$28 | 15x | US$347 |
| Base | US$36 | 20x | US$595 |
| Bull: AI lifts growth | US$42 | 24x | US$833 |
Fair value = FY2028 EPS × P/E ÷ 1.10², with the base EPS anchored to the analyst consensus of US$34.63 for FY2027 (StockAnalysis, 23 October 2026) grown about 4%.
Two traps when valuing Meta
Earnings that hide the spending. Capital expenditure hits cash immediately but reaches the income statement only gradually through depreciation. A P/E on current earnings can look modest while free cash flow is close to zero, and was negative in the September 2026 quarter.
One-off items in both directions. Meta’s EPS has swung with tax items, such as a US$15.9 billion non-cash tax charge in the September 2025 quarter, and with legal charges, including US$9.9 billion in the September 2026 quarter. Trailing P/E ratios can mislead unless these are understood. Per-share figures will also shift in 2027, when Meta expects its one-for-one Class C stock dividend to work like a two-for-one split; our estimates are on today’s share count.
Share price vs our fair value estimate
Weekly closing price over two years, with each fair value estimate from the date we published it. The shaded band is our bear-to-bull range.
First estimate published 20 October 2026. The dashed line shows the estimate in force; until we revise it, it is drawn across the whole period for comparison. Latest weekly price US$611.79. Prices from Yahoo Finance, refreshed daily. The estimate changes only when we revise it.
What we would watch
- Fourth quarter 2026 results, against guidance of US$73–76 billion of revenue.
- Any first indication of 2027 capital expenditure and expense plans.
- Outcomes of the youth-related trials scheduled in the coming months and any further legal charges.
- Free cash flow and the pace of new borrowing to fund data centres.
- Reality Labs losses, which Meta expects to narrow to about US$15 billion in 2027, and the Class C stock dividend planned for early 2027.
The short version
Meta owns one of the strongest advertising businesses ever built, and AI is currently making it stronger. But it is spending at a scale that changes the character of the company, from a cash machine to a heavy investor, while legal costs mount. Our base case fair value of about US$595 sits below the current share price, which tells us the market is giving more credit to the AI bet than our conservative assumptions do.
Frequently asked questions
What does Meta do?
Meta owns Facebook, Instagram, WhatsApp, Messenger and Threads, and earns almost all its revenue by selling advertising inside those apps. Its Reality Labs division makes virtual reality headsets and AI glasses.
How many people use Meta’s apps?
On average, 3.64 billion people used at least one of Meta’s apps each day in September 2026, up 3% on a year earlier.
How much is Meta spending on AI?
Meta expects capital expenditure, mostly on AI data centres and chips, of US$135 billion to US$145 billion in 2026, up from US$72.2 billion in 2025.
Does Meta pay a dividend?
Yes. Meta has paid a quarterly dividend since March 2024 and currently pays US$0.525 a share each quarter, or US$2.10 a year.
Is Meta a buy?
We don’t make buy or sell recommendations. Our fair value estimate, set out above with its assumptions, is our opinion of what the business may be worth, not advice. Whether any investment suits you depends on your own circumstances, so speak to a licensed financial adviser.
Sources
- Meta third quarter 2026 results (press release)
- Meta third quarter 2026 results (PDF)
- Meta second quarter 2026 results (Form 8-K, exhibit 99.1)
- Meta first quarter 2026 results (exhibit 99.1)
- Meta fourth quarter and full year 2025 results (exhibit 99.1)
- Meta third quarter 2025 results (Form 8-K, exhibit 99.1)
- Meta second quarter 2025 results (Form 8-K, exhibit 99.1)
- Meta to announce third quarter 2026 results
- StockAnalysis: META statistics
- StockAnalysis: META forecast
- StockAnalysis: META dividend
- StockAnalysis: META income statement
- StockAnalysis: META cash flow statement
- StockAnalysis: GOOGL statistics
- StockAnalysis: PINS statistics
- Verdict: Meta Q2 2026 results
- NBC Bay Area (Reuters/CNBC): Meta first quarter 2026 results
- Reuters via AOL: Meta 2026 capital expenditure outlook
- DatacenterDynamics: Meta and Blue Owl Hyperion joint venture
- Wikipedia: Meta Platforms
- Wikipedia: Instagram
Disclosure: Lindy Capital may hold, buy or sell shares in Meta Platforms (META) at any time, without notice, and does not disclose its positions. This is a study of how a business works, not a recommendation to buy, sell or hold any security. Our fair value estimate is an opinion based on the assumptions stated with it, not a price target or a forecast of the share price. Company guidance and analysts’ estimates are shown as reported. Figures are from public filings and data providers and will date. Important information.